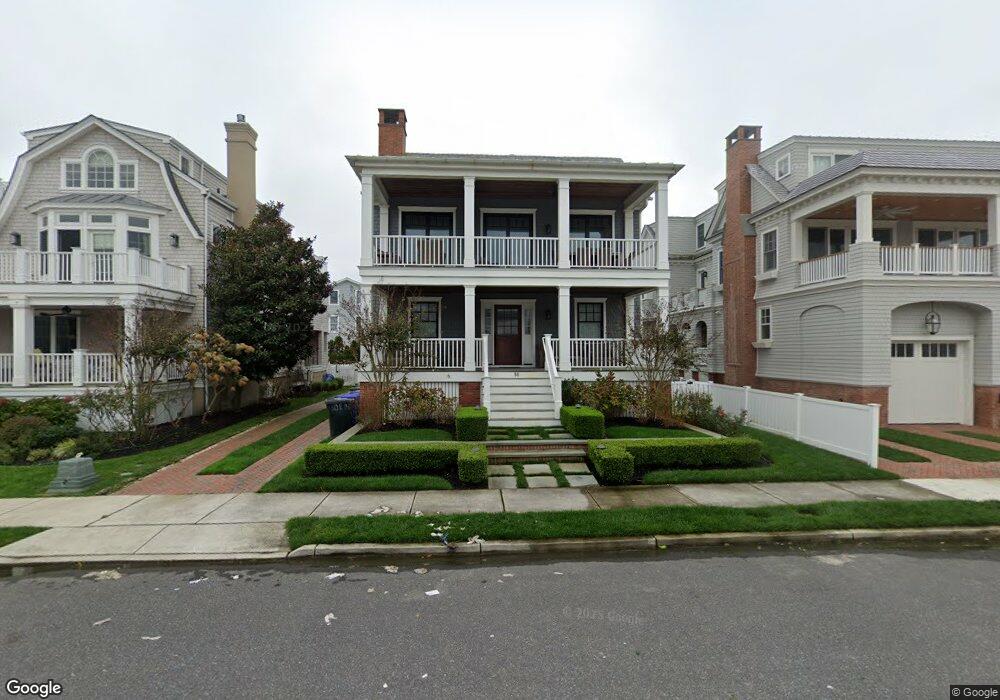
50 14th St E Avalon, NJ 08202
Estimated Value: $5,284,000 - $5,766,285
Studio
--
Bath
3,810
Sq Ft
$1,450/Sq Ft
Est. Value
About This Home
This home is located at 50 14th St E, Avalon, NJ 08202 and is currently estimated at $5,525,821, approximately $1,450 per square foot. 50 14th St E is a home located in Cape May County with nearby schools including Avalon Elementary School.
Ownership History
Date
Name
Owned For
Owner Type
Purchase Details
Closed on
Oct 16, 2017
Sold by
Winfield Developers Llc
Bought by
Kimmel Craig T and Kimmel Shannon R
Current Estimated Value
Home Financials for this Owner
Home Financials are based on the most recent Mortgage that was taken out on this home.
Original Mortgage
$517,500
Outstanding Balance
$431,794
Interest Rate
3.78%
Mortgage Type
Future Advance Clause Open End Mortgage
Estimated Equity
$5,094,027
Purchase Details
Closed on
Oct 28, 2016
Sold by
Schilgen Rexford W and Schilgen John R
Bought by
Winfield Developers Llc
Home Financials for this Owner
Home Financials are based on the most recent Mortgage that was taken out on this home.
Original Mortgage
$1,995,000
Interest Rate
3.42%
Mortgage Type
Commercial
Create a Home Valuation Report for This Property
The Home Valuation Report is an in-depth analysis detailing your home's value as well as a comparison with similar homes in the area
Home Values in the Area
Average Home Value in this Area
Purchase History
| Date | Buyer | Sale Price | Title Company |
|---|---|---|---|
| Kimmel Craig T | $3,450,000 | Dune Abstract Company Inc | |
| Winfield Developers Llc | $1,600,000 | None Available |
Source: Public Records
Mortgage History
| Date | Status | Borrower | Loan Amount |
|---|---|---|---|
| Open | Kimmel Craig T | $517,500 | |
| Previous Owner | Winfield Developers Llc | $1,995,000 |
Source: Public Records
Tax History
| Year | Tax Paid | Tax Assessment Tax Assessment Total Assessment is a certain percentage of the fair market value that is determined by local assessors to be the total taxable value of land and additions on the property. | Land | Improvement |
|---|---|---|---|---|
| 2025 | $19,130 | $3,115,600 | $1,700,000 | $1,415,600 |
| 2024 | $19,130 | $3,115,600 | $1,700,000 | $1,415,600 |
| 2023 | $18,974 | $3,115,600 | $1,700,000 | $1,415,600 |
| 2022 | $17,697 | $3,115,600 | $1,700,000 | $1,415,600 |
| 2021 | $17,042 | $3,115,600 | $1,700,000 | $1,415,600 |
| 2020 | $16,388 | $3,115,600 | $1,700,000 | $1,415,600 |
| 2019 | $15,890 | $3,115,600 | $1,700,000 | $1,415,600 |
| 2018 | $15,204 | $3,115,600 | $1,700,000 | $1,415,600 |
| 2017 | $7,784 | $1,400,000 | $1,400,000 | $0 |
| 2016 | $7,820 | $1,421,800 | $1,400,000 | $21,800 |
| 2015 | $7,692 | $1,421,800 | $1,400,000 | $21,800 |
| 2014 | $7,607 | $1,421,800 | $1,400,000 | $21,800 |
Source: Public Records
Map
Nearby Homes
Your Personal Tour Guide
Ask me questions while you tour the home.