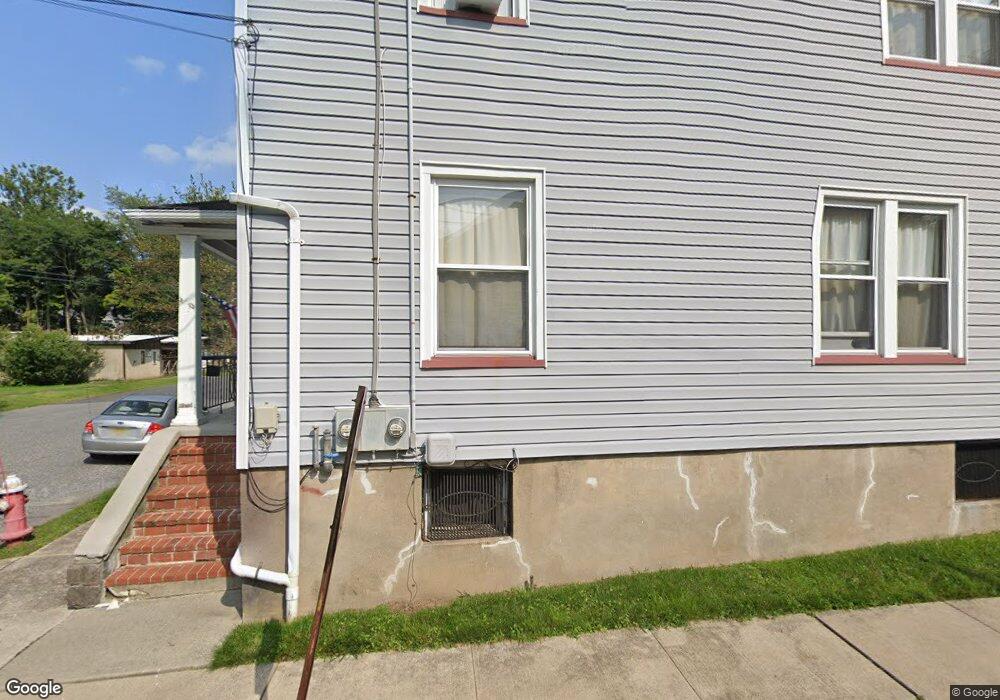
50 2nd St Unit 54 Belvidere, NJ 07823
Estimated Value: $447,000 - $518,000
--
Bed
--
Bath
4,036
Sq Ft
$119/Sq Ft
Est. Value
About This Home
This home is located at 50 2nd St Unit 54, Belvidere, NJ 07823 and is currently estimated at $481,838, approximately $119 per square foot. 50 2nd St Unit 54 is a home located in Warren County with nearby schools including Belvidere Elementary School, Third Street Elementary School, and Belvidere High School.
Ownership History
Date
Name
Owned For
Owner Type
Purchase Details
Closed on
Apr 20, 2021
Sold by
Hendrickson Denise M and Hendrickson Mark Ruggier
Bought by
Davidson Nathaniel and Davidson Niccole
Current Estimated Value
Home Financials for this Owner
Home Financials are based on the most recent Mortgage that was taken out on this home.
Original Mortgage
$292,500
Outstanding Balance
$264,514
Interest Rate
3.1%
Mortgage Type
New Conventional
Estimated Equity
$217,324
Purchase Details
Closed on
Jan 18, 1991
Bought by
Hendrickson Clifford A and Hendrickson Denise M
Create a Home Valuation Report for This Property
The Home Valuation Report is an in-depth analysis detailing your home's value as well as a comparison with similar homes in the area
Home Values in the Area
Average Home Value in this Area
Purchase History
| Date | Buyer | Sale Price | Title Company |
|---|---|---|---|
| Davidson Nathaniel | $390,000 | Sunrise Title Services Inc | |
| Davidson Nathaniel | $390,000 | Fidelity National Title | |
| Hendrickson Clifford A | $140,000 | -- |
Source: Public Records
Mortgage History
| Date | Status | Borrower | Loan Amount |
|---|---|---|---|
| Open | Davidson Nathaniel | $292,500 | |
| Closed | Davidson Nathaniel | $292,500 |
Source: Public Records
Tax History Compared to Growth
Tax History
| Year | Tax Paid | Tax Assessment Tax Assessment Total Assessment is a certain percentage of the fair market value that is determined by local assessors to be the total taxable value of land and additions on the property. | Land | Improvement |
|---|---|---|---|---|
| 2025 | $11,274 | $354,200 | $46,800 | $307,400 |
| 2024 | $10,902 | $354,200 | $46,800 | $307,400 |
| 2023 | $10,530 | $354,200 | $46,800 | $307,400 |
| 2022 | $10,530 | $179,300 | $22,500 | $156,800 |
| 2021 | $10,288 | $179,300 | $22,500 | $156,800 |
| 2020 | $10,211 | $179,300 | $22,500 | $156,800 |
| 2019 | $10,437 | $179,300 | $22,500 | $156,800 |
| 2018 | $10,437 | $179,300 | $22,500 | $156,800 |
| 2017 | $10,100 | $179,300 | $22,500 | $156,800 |
| 2016 | $9,973 | $179,300 | $22,500 | $156,800 |
| 2015 | $9,790 | $179,300 | $22,500 | $156,800 |
| 2014 | $9,720 | $179,300 | $22,500 | $156,800 |
Source: Public Records
Map
Nearby Homes