Estimated Value: $290,000 - $346,613
3
Beds
1
Bath
950
Sq Ft
$341/Sq Ft
Est. Value
About This Home
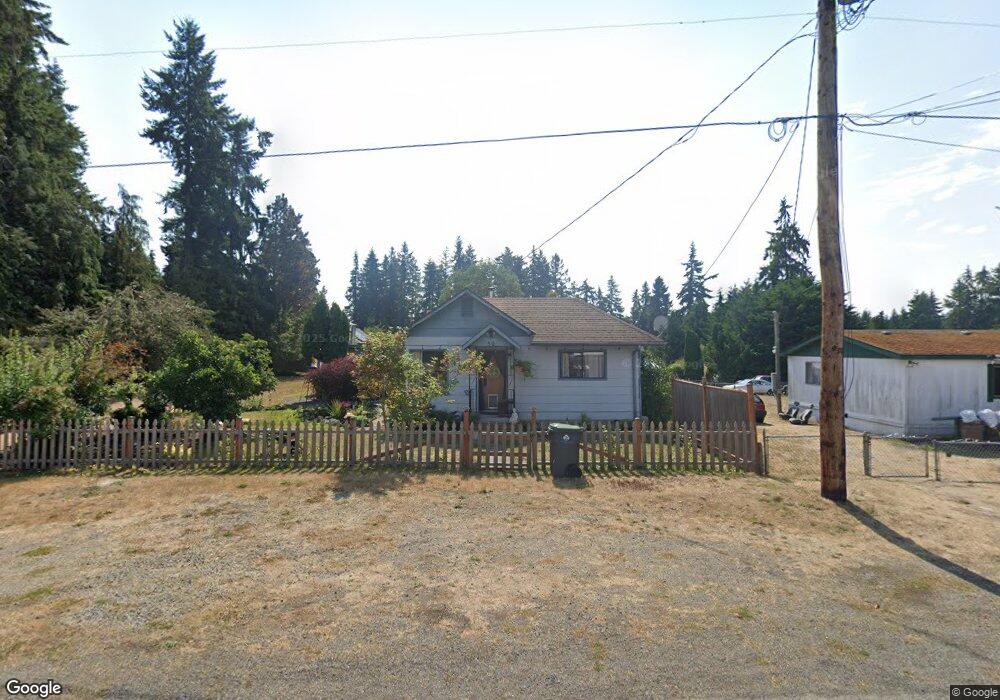
This home is located at 50 2nd St, Port Hadlock, WA 98339 and is currently estimated at $323,871, approximately $340 per square foot. 50 2nd St is a home located in Jefferson County with nearby schools including Chimacum Creek Primary School, Chimacum School Pi Program, and Chimacum Elementary School.
Ownership History
Date
Name
Owned For
Owner Type
Purchase Details
Closed on
May 26, 2020
Sold by
Anderson Ronald W
Bought by
Atwood Lester J and Atwood Toni S
Current Estimated Value
Purchase Details
Closed on
Dec 31, 2015
Sold by
Bartman Karolyn O
Bought by
Anderson Ronald W
Create a Home Valuation Report for This Property
The Home Valuation Report is an in-depth analysis detailing your home's value as well as a comparison with similar homes in the area
Home Values in the Area
Average Home Value in this Area
Purchase History
| Date | Buyer | Sale Price | Title Company |
|---|---|---|---|
| Atwood Lester J | -- | None Available | |
| Anderson Ronald W | $280 | None Available |
Source: Public Records
Tax History Compared to Growth
Tax History
| Year | Tax Paid | Tax Assessment Tax Assessment Total Assessment is a certain percentage of the fair market value that is determined by local assessors to be the total taxable value of land and additions on the property. | Land | Improvement |
|---|---|---|---|---|
| 2024 | $1,761 | $236,900 | $58,931 | $177,969 |
| 2023 | $1,761 | $221,005 | $51,125 | $169,880 |
| 2022 | $1,581 | $193,496 | $46,125 | $147,371 |
| 2021 | $1,560 | $176,332 | $39,878 | $136,454 |
| 2020 | $319 | $163,517 | $36,810 | $126,707 |
| 2019 | $321 | $145,830 | $33,743 | $112,087 |
| 2018 | $336 | $133,015 | $30,675 | $102,340 |
| 2017 | $350 | $128,142 | $30,675 | $97,467 |
| 2016 | $1,209 | $114,140 | $26,675 | $87,465 |
| 2015 | $1,190 | $114,140 | $26,675 | $87,465 |
| 2014 | -- | $114,140 | $26,675 | $87,465 |
| 2013 | -- | $103,765 | $24,250 | $79,515 |
Source: Public Records
Map
Nearby Homes
- 31 2nd St
- 611 Cedar Ave Unit 51
- 611 Cedar Ave Unit 33
- 611 Cedar Ave Unit 62
- 31 Petes Spur
- 0 NKA C St
- 1210 Irondale Rd
- 0 901024068 Unit NWM2387187
- 0 901024068 Unit Port Hadlock WA 9833
- 51 Thomas Dr
- 153 Sunset Meadows Ln
- 177 Sunset Meadows Ln
- 781 Irondale Rd
- 0 E Eugene St
- 371 E Price St
- 10955 NKA Rhody Dr
- 52 E Moore St
- 13 Loretta Ln
- 2 Lylus Ln
- 1 Lylus Ln