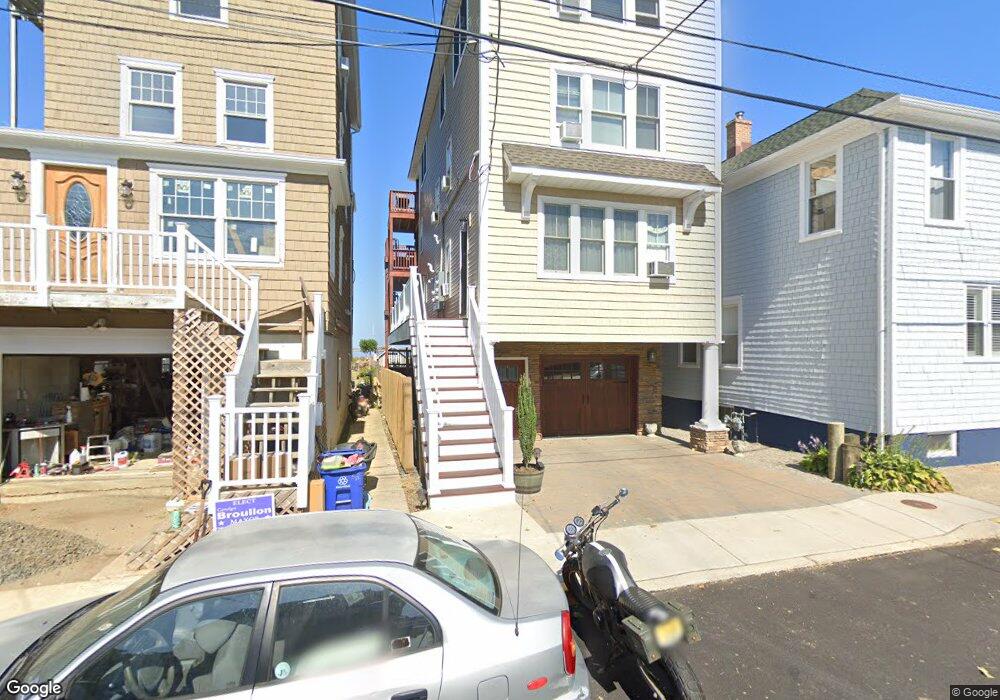
50 5th St Highlands, NJ 07732
Estimated Value: $763,000 - $1,146,000
--
Bed
4
Baths
2,508
Sq Ft
$382/Sq Ft
Est. Value
About This Home
This home is located at 50 5th St, Highlands, NJ 07732 and is currently estimated at $958,575, approximately $382 per square foot. 50 5th St is a home located in Monmouth County with nearby schools including Highlands Elementary School, Henry Hudson Regional School, and Holy Cross School.
Ownership History
Date
Name
Owned For
Owner Type
Purchase Details
Closed on
Dec 14, 1994
Sold by
Fgb Realty Advisors
Bought by
Hebrank Ronald
Current Estimated Value
Home Financials for this Owner
Home Financials are based on the most recent Mortgage that was taken out on this home.
Original Mortgage
$50,000
Interest Rate
9.23%
Mortgage Type
Commercial
Create a Home Valuation Report for This Property
The Home Valuation Report is an in-depth analysis detailing your home's value as well as a comparison with similar homes in the area
Home Values in the Area
Average Home Value in this Area
Purchase History
| Date | Buyer | Sale Price | Title Company |
|---|---|---|---|
| Hebrank Ronald | $53,000 | -- |
Source: Public Records
Mortgage History
| Date | Status | Borrower | Loan Amount |
|---|---|---|---|
| Closed | Hebrank Ronald | $50,000 |
Source: Public Records
Tax History
| Year | Tax Paid | Tax Assessment Tax Assessment Total Assessment is a certain percentage of the fair market value that is determined by local assessors to be the total taxable value of land and additions on the property. | Land | Improvement |
|---|---|---|---|---|
| 2025 | $11,155 | $800,500 | $352,100 | $448,400 |
| 2024 | $10,636 | $563,400 | $255,300 | $308,100 |
| 2023 | $10,636 | $530,200 | $230,100 | $300,100 |
| 2022 | $8,780 | $492,400 | $208,100 | $284,300 |
| 2021 | $8,780 | $353,900 | $189,200 | $164,700 |
| 2020 | $8,679 | $349,400 | $189,200 | $160,200 |
| 2019 | $6,441 | $228,000 | $189,200 | $38,800 |
| 2018 | $6,229 | $222,300 | $189,200 | $33,100 |
| 2017 | $6,251 | $222,300 | $189,200 | $33,100 |
| 2016 | $6,151 | $222,300 | $189,200 | $33,100 |
| 2015 | $6,166 | $220,600 | $189,200 | $31,400 |
| 2014 | $9,780 | $362,500 | $336,500 | $26,000 |
Source: Public Records
Map
Nearby Homes
- 10 5th St
- 205 Bay Ave
- 251 Bay Ave
- 207 Marina Dr Unit 4
- 103 Shore Dr
- 61 Barberie Ave
- 14 Seadrift Ave
- 86 Seadrift Ave
- 52 Barberie Ave
- 52 Washington Ave
- 25 Shrewsbury Ave
- 11 Cheerful Place
- 100 Navesink Ave Unit 1
- 28 Coquette Ln
- 324 Shore Dr Unit A4
- 26 Ralph St
- 14 Hilltop Terrace Unit B
- 75 Portland Rd
- 1 Scenic Dr Unit 511
- 1 Scenic Dr Unit 204
Your Personal Tour Guide
Ask me questions while you tour the home.