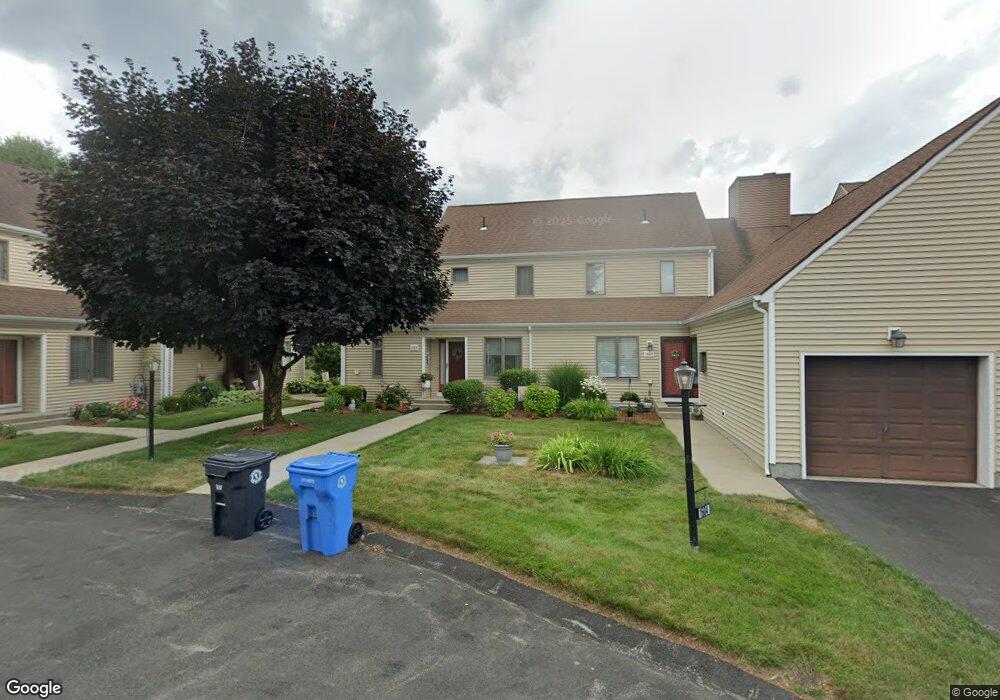
50 Abbott Run Vly Rd Unit 1603 Cumberland, RI 02864
Arnold Mills NeighborhoodEstimated Value: $328,318 - $440,000
2
Beds
2
Baths
1,150
Sq Ft
$339/Sq Ft
Est. Value
About This Home
This home is located at 50 Abbott Run Vly Rd Unit 1603, Cumberland, RI 02864 and is currently estimated at $389,330, approximately $338 per square foot. 50 Abbott Run Vly Rd Unit 1603 is a home located in Providence County with nearby schools including Garvin Memorial School, Joseph L. McCourt Middle School, and Cumberland High School.
Ownership History
Date
Name
Owned For
Owner Type
Purchase Details
Closed on
Feb 6, 2020
Sold by
Nischo Richard P and Nischo Dorothy J
Bought by
Nischo Paul and Ziroli Kim
Current Estimated Value
Purchase Details
Closed on
Jun 10, 2016
Sold by
Hvitfelt Johanna I
Bought by
Nischo Richard P and Nischo Dorothy J
Home Financials for this Owner
Home Financials are based on the most recent Mortgage that was taken out on this home.
Original Mortgage
$60,000
Interest Rate
3.66%
Mortgage Type
Purchase Money Mortgage
Purchase Details
Closed on
Dec 16, 2011
Sold by
Halpin Michael
Bought by
Ihvitfelt Johanna
Purchase Details
Closed on
Jun 23, 1999
Sold by
Mccue Michael P and Mccue Pamela L
Bought by
Halpin Michael
Home Financials for this Owner
Home Financials are based on the most recent Mortgage that was taken out on this home.
Original Mortgage
$100,000
Interest Rate
7.09%
Create a Home Valuation Report for This Property
The Home Valuation Report is an in-depth analysis detailing your home's value as well as a comparison with similar homes in the area
Home Values in the Area
Average Home Value in this Area
Purchase History
| Date | Buyer | Sale Price | Title Company |
|---|---|---|---|
| Nischo Paul | -- | None Available | |
| Nischo Richard P | $185,000 | -- | |
| Ihvitfelt Johanna | $164,500 | -- | |
| Halpin Michael | $137,000 | -- |
Source: Public Records
Mortgage History
| Date | Status | Borrower | Loan Amount |
|---|---|---|---|
| Previous Owner | Halpin Michael | $60,000 | |
| Previous Owner | Halpin Michael | $100,000 |
Source: Public Records
Tax History Compared to Growth
Tax History
| Year | Tax Paid | Tax Assessment Tax Assessment Total Assessment is a certain percentage of the fair market value that is determined by local assessors to be the total taxable value of land and additions on the property. | Land | Improvement |
|---|---|---|---|---|
| 2025 | $2,956 | $240,900 | $0 | $240,900 |
| 2024 | $2,879 | $240,900 | $0 | $240,900 |
| 2023 | $2,799 | $240,900 | $0 | $240,900 |
| 2022 | $2,785 | $185,800 | $0 | $185,800 |
| 2021 | $2,739 | $185,800 | $0 | $185,800 |
| 2020 | $2,661 | $185,800 | $0 | $185,800 |
| 2019 | $2,849 | $179,400 | $0 | $179,400 |
| 2018 | $2,766 | $179,400 | $0 | $179,400 |
| 2017 | $2,729 | $179,400 | $0 | $179,400 |
| 2016 | $2,856 | $167,200 | $0 | $167,200 |
| 2015 | $2,856 | $167,200 | $0 | $167,200 |
| 2014 | $2,856 | $167,200 | $0 | $167,200 |
| 2013 | $3,023 | $191,600 | $0 | $191,600 |
Source: Public Records
Map
Nearby Homes
- 164 Bear Hill Rd Unit 24
- 44 Powder Horn Way
- 154 Bear Hill Rd Unit 405
- 15 Standring St
- 160 Shirley Dr
- 30 Bear Hill Rd
- 56 Greenfield Rd
- 105 Newell Dr
- 143 Millard Rd
- 44 Montclair Dr
- 41&39 Indiana Ave
- 41 Indiana Ave
- 143 Waumsett Ave
- 94 Hines Rd
- 140 Abbott Run Valley Rd
- 66 Pequot Ave
- 807 Paine Rd
- 181 Paine Rd
- 34 Stone Ridge Rd
- 0 Narragansett Rd
- 50 Abbott Run Vly Rd Unit 1931
- 50 Abbott Run Vly Rd Unit 1936
- 50 Abbott Run Vly Rd Unit 1803
- 50 Abbott Run Vly Rd Unit 1703
- 50 Abbott Run Vly Rd Unit 1805
- 50 Abbott Run Vly Rd Unit 1604
- 50 Abbott Run Vly Rd Unit 1928
- 50 Abbott Run Vly Rd Unit 1933
- 50 Abbott Run Vly Rd Unit 1932
- 50 Abbott Run Vly Rd Unit 1938
- 50 Abbott Run Vly Rd Unit 1934
- 50 Abbott Run Vly Rd Unit 1927
- 50 Abbott Run Vly Rd Unit 1939
- 50 Abbott Run Vly Rd Unit 1601
- 50 Abbott Run Vly Rd Unit 1926
- 50 Abbott Run Vly Rd Unit 1606
- 50 Abbott Run Vly Rd Unit 1806
- 50 Abbott Run Vly Rd Unit 1602
- 50 Abbott Run Vly Rd Unit 1937
- 50 Abbott Run Vly Rd Unit 1804