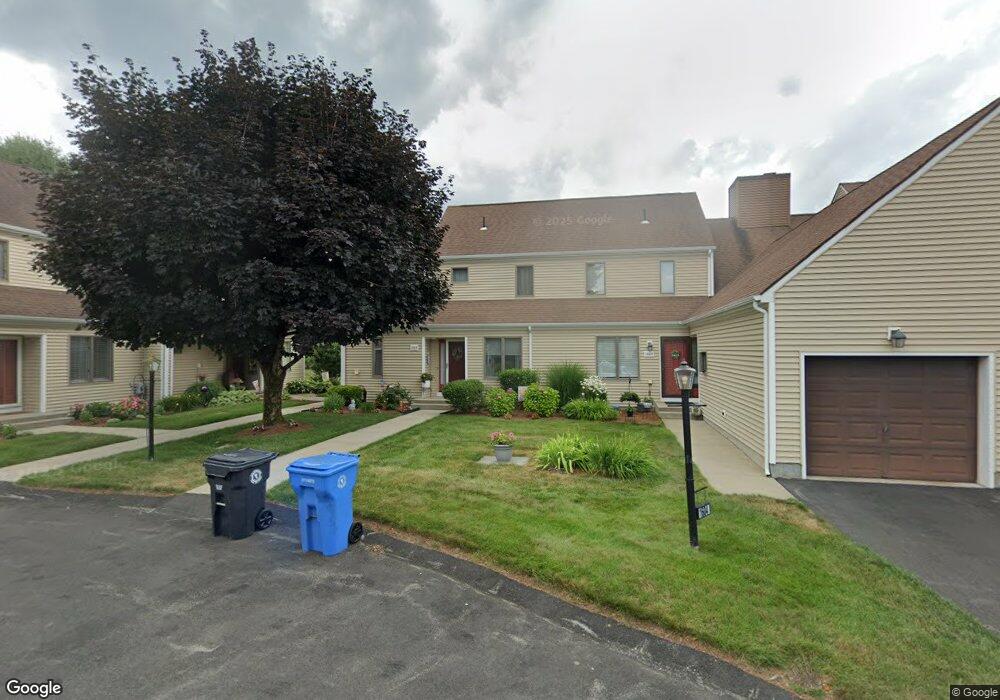
50 Abbott Run Vly Rd Unit 1803 Cumberland, RI 02864
Arnold Mills NeighborhoodEstimated Value: $333,108 - $460,000
2
Beds
2
Baths
1,170
Sq Ft
$335/Sq Ft
Est. Value
About This Home
This home is located at 50 Abbott Run Vly Rd Unit 1803, Cumberland, RI 02864 and is currently estimated at $391,777, approximately $334 per square foot. 50 Abbott Run Vly Rd Unit 1803 is a home located in Providence County with nearby schools including Garvin Memorial School, Joseph L. McCourt Middle School, and Cumberland High School.
Ownership History
Date
Name
Owned For
Owner Type
Purchase Details
Closed on
Feb 19, 2016
Sold by
Pmm Ft
Bought by
Krishchuk Victor
Current Estimated Value
Home Financials for this Owner
Home Financials are based on the most recent Mortgage that was taken out on this home.
Original Mortgage
$171,000
Outstanding Balance
$136,407
Interest Rate
3.97%
Mortgage Type
Purchase Money Mortgage
Estimated Equity
$255,370
Purchase Details
Closed on
Sep 12, 2013
Sold by
Mason Royal D and Mason Joan M
Bought by
Pmm Ft
Purchase Details
Closed on
Jan 14, 2008
Sold by
Lecours Louise M
Bought by
Dean Royal and Mason Joan
Purchase Details
Closed on
Oct 25, 1990
Sold by
Rosewood Dev Corp
Bought by
Lecours Louise M
Home Financials for this Owner
Home Financials are based on the most recent Mortgage that was taken out on this home.
Original Mortgage
$69,900
Interest Rate
10.08%
Create a Home Valuation Report for This Property
The Home Valuation Report is an in-depth analysis detailing your home's value as well as a comparison with similar homes in the area
Home Values in the Area
Average Home Value in this Area
Purchase History
| Date | Buyer | Sale Price | Title Company |
|---|---|---|---|
| Krishchuk Victor | $180,000 | -- | |
| Pmm Ft | -- | -- | |
| Dean Royal | $237,500 | -- | |
| Lecours Louise M | $120,000 | -- |
Source: Public Records
Mortgage History
| Date | Status | Borrower | Loan Amount |
|---|---|---|---|
| Open | Lecours Louise M | $171,000 | |
| Previous Owner | Lecours Louise M | $69,900 |
Source: Public Records
Tax History Compared to Growth
Tax History
| Year | Tax Paid | Tax Assessment Tax Assessment Total Assessment is a certain percentage of the fair market value that is determined by local assessors to be the total taxable value of land and additions on the property. | Land | Improvement |
|---|---|---|---|---|
| 2025 | $2,961 | $241,300 | $0 | $241,300 |
| 2024 | $2,884 | $241,300 | $0 | $241,300 |
| 2023 | $2,804 | $241,300 | $0 | $241,300 |
| 2022 | $2,788 | $186,000 | $0 | $186,000 |
| 2021 | $2,742 | $186,000 | $0 | $186,000 |
| 2020 | $2,664 | $186,000 | $0 | $186,000 |
| 2019 | $2,858 | $180,000 | $0 | $180,000 |
| 2018 | $2,776 | $180,000 | $0 | $180,000 |
| 2017 | $2,738 | $180,000 | $0 | $180,000 |
| 2016 | $2,856 | $167,200 | $0 | $167,200 |
| 2015 | $2,856 | $167,200 | $0 | $167,200 |
| 2014 | $2,856 | $167,200 | $0 | $167,200 |
| 2013 | $3,023 | $191,600 | $0 | $191,600 |
Source: Public Records
Map
Nearby Homes
- 164 Bear Hill Rd Unit 24
- 44 Powder Horn Way
- 154 Bear Hill Rd Unit 405
- 15 Standring St
- 160 Shirley Dr
- 30 Bear Hill Rd
- 56 Greenfield Rd
- 105 Newell Dr
- 143 Millard Rd
- 44 Montclair Dr
- 41&39 Indiana Ave
- 41 Indiana Ave
- 143 Waumsett Ave
- 94 Hines Rd
- 140 Abbott Run Valley Rd
- 66 Pequot Ave
- 807 Paine Rd
- 181 Paine Rd
- 34 Stone Ridge Rd
- 0 Narragansett Rd
- 50 Abbott Run Vly Rd Unit 1931
- 50 Abbott Run Vly Rd Unit 1936
- 50 Abbott Run Vly Rd Unit 1703
- 50 Abbott Run Vly Rd Unit 1805
- 50 Abbott Run Vly Rd Unit 1604
- 50 Abbott Run Vly Rd Unit 1928
- 50 Abbott Run Vly Rd Unit 1933
- 50 Abbott Run Vly Rd Unit 1932
- 50 Abbott Run Vly Rd Unit 1938
- 50 Abbott Run Vly Rd Unit 1934
- 50 Abbott Run Vly Rd Unit 1927
- 50 Abbott Run Vly Rd Unit 1939
- 50 Abbott Run Vly Rd Unit 1601
- 50 Abbott Run Vly Rd Unit 1926
- 50 Abbott Run Vly Rd Unit 1606
- 50 Abbott Run Vly Rd Unit 1806
- 50 Abbott Run Vly Rd Unit 1602
- 50 Abbott Run Vly Rd Unit 1937
- 50 Abbott Run Vly Rd Unit 1603
- 50 Abbott Run Vly Rd Unit 1804