Estimated Value: $767,720 - $1,025,000
3
Beds
2
Baths
1,764
Sq Ft
$486/Sq Ft
Est. Value
About This Home
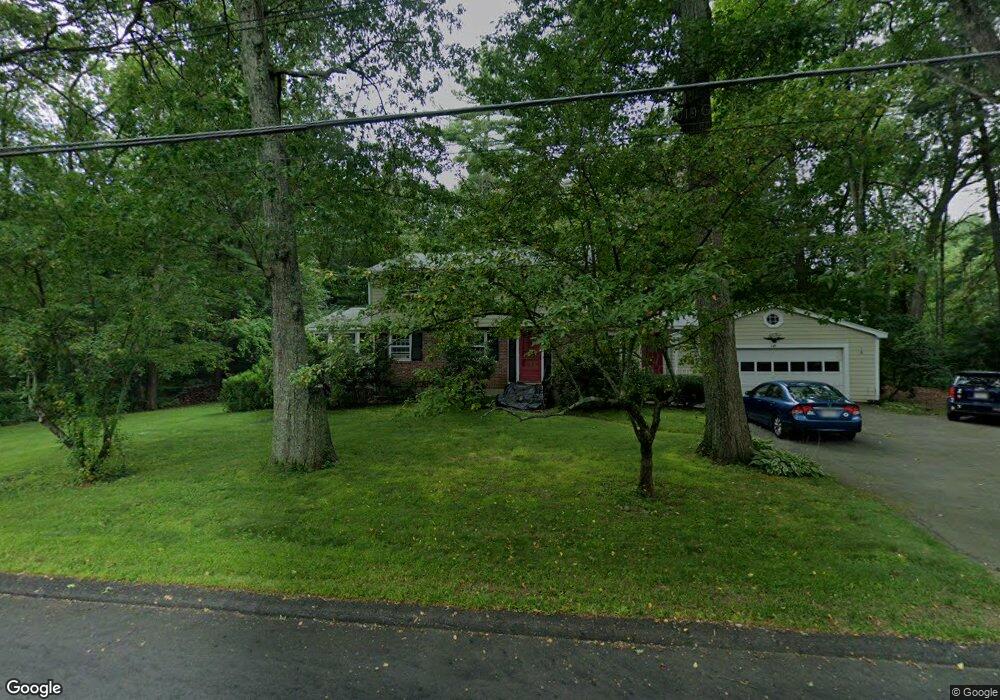
This home is located at 50 Alcott St, Acton, MA 01720 and is currently estimated at $856,680, approximately $485 per square foot. 50 Alcott St is a home located in Middlesex County with nearby schools including Acton-Boxborough Regional High School and Concord Academy.
Ownership History
Date
Name
Owned For
Owner Type
Purchase Details
Closed on
Jul 1, 1997
Sold by
Lowry David W and Lowry Beverly
Bought by
Ward Richard Z and Ward Susan E
Current Estimated Value
Home Financials for this Owner
Home Financials are based on the most recent Mortgage that was taken out on this home.
Original Mortgage
$214,600
Outstanding Balance
$31,600
Interest Rate
7.81%
Mortgage Type
Purchase Money Mortgage
Estimated Equity
$825,080
Create a Home Valuation Report for This Property
The Home Valuation Report is an in-depth analysis detailing your home's value as well as a comparison with similar homes in the area
Home Values in the Area
Average Home Value in this Area
Purchase History
| Date | Buyer | Sale Price | Title Company |
|---|---|---|---|
| Ward Richard Z | $274,000 | -- |
Source: Public Records
Mortgage History
| Date | Status | Borrower | Loan Amount |
|---|---|---|---|
| Open | Ward Richard Z | $214,600 | |
| Previous Owner | Ward Richard Z | $180,000 | |
| Previous Owner | Ward Richard Z | $120,000 |
Source: Public Records
Tax History Compared to Growth
Tax History
| Year | Tax Paid | Tax Assessment Tax Assessment Total Assessment is a certain percentage of the fair market value that is determined by local assessors to be the total taxable value of land and additions on the property. | Land | Improvement |
|---|---|---|---|---|
| 2025 | $12,381 | $721,900 | $341,000 | $380,900 |
| 2024 | $11,629 | $697,600 | $341,000 | $356,600 |
| 2023 | $11,505 | $655,200 | $309,900 | $345,300 |
| 2022 | $10,906 | $560,700 | $269,500 | $291,200 |
| 2021 | $10,625 | $525,200 | $249,500 | $275,700 |
| 2020 | $10,032 | $521,400 | $249,500 | $271,900 |
| 2019 | $9,536 | $492,300 | $249,500 | $242,800 |
| 2018 | $9,393 | $484,700 | $249,500 | $235,200 |
| 2017 | $9,309 | $488,400 | $249,500 | $238,900 |
| 2016 | $9,163 | $476,500 | $249,500 | $227,000 |
| 2015 | $9,001 | $472,500 | $249,500 | $223,000 |
| 2014 | $8,768 | $450,800 | $249,500 | $201,300 |
Source: Public Records
Map
Nearby Homes