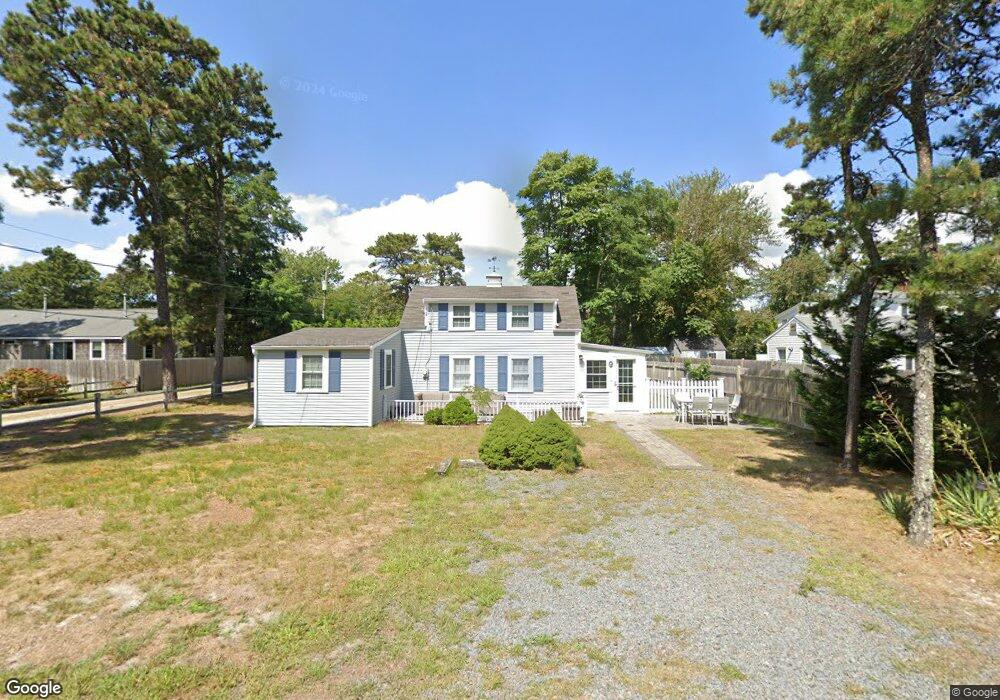
50 Arbor Way Dennis Port, MA 02639
Dennis Port NeighborhoodEstimated Value: $634,000 - $755,000
3
Beds
1
Bath
1,248
Sq Ft
$560/Sq Ft
Est. Value
About This Home
This home is located at 50 Arbor Way, Dennis Port, MA 02639 and is currently estimated at $698,597, approximately $559 per square foot. 50 Arbor Way is a home located in Barnstable County with nearby schools including Dennis-Yarmouth Regional High School and St. Pius X. School.
Ownership History
Date
Name
Owned For
Owner Type
Purchase Details
Closed on
Aug 17, 2010
Sold by
Briand Dennis C and Briand Maureen S
Bought by
Curtis Brian J and Curtis Carolyn M
Current Estimated Value
Home Financials for this Owner
Home Financials are based on the most recent Mortgage that was taken out on this home.
Original Mortgage
$159,000
Outstanding Balance
$105,592
Interest Rate
4.63%
Mortgage Type
Purchase Money Mortgage
Estimated Equity
$593,005
Purchase Details
Closed on
Apr 21, 2004
Sold by
Koda Rt and Guerra Anthony
Bought by
Briand Dennis C and Briand Maureen S
Home Financials for this Owner
Home Financials are based on the most recent Mortgage that was taken out on this home.
Original Mortgage
$276,000
Interest Rate
5.4%
Mortgage Type
Purchase Money Mortgage
Purchase Details
Closed on
May 11, 1998
Sold by
Moran Eldon J and Comey Nicholas P
Bought by
Koda Rt and Guerra Anthony
Home Financials for this Owner
Home Financials are based on the most recent Mortgage that was taken out on this home.
Original Mortgage
$40,000
Interest Rate
7.05%
Mortgage Type
Purchase Money Mortgage
Create a Home Valuation Report for This Property
The Home Valuation Report is an in-depth analysis detailing your home's value as well as a comparison with similar homes in the area
Home Values in the Area
Average Home Value in this Area
Purchase History
| Date | Buyer | Sale Price | Title Company |
|---|---|---|---|
| Curtis Brian J | $353,000 | -- | |
| Briand Dennis C | $345,000 | -- | |
| Koda Rt | $71,000 | -- |
Source: Public Records
Mortgage History
| Date | Status | Borrower | Loan Amount |
|---|---|---|---|
| Open | Curtis Brian J | $159,000 | |
| Previous Owner | Koda Rt | $232,500 | |
| Previous Owner | Briand Dennis C | $276,000 | |
| Previous Owner | Koda Rt | $100,000 | |
| Previous Owner | Koda Rt | $40,000 |
Source: Public Records
Tax History Compared to Growth
Tax History
| Year | Tax Paid | Tax Assessment Tax Assessment Total Assessment is a certain percentage of the fair market value that is determined by local assessors to be the total taxable value of land and additions on the property. | Land | Improvement |
|---|---|---|---|---|
| 2025 | $2,675 | $617,700 | $283,900 | $333,800 |
| 2024 | $2,543 | $579,300 | $273,000 | $306,300 |
| 2023 | $2,460 | $526,700 | $248,200 | $278,500 |
| 2022 | $2,247 | $401,200 | $195,600 | $205,600 |
| 2021 | $2,134 | $353,900 | $191,800 | $162,100 |
| 2020 | $2,102 | $344,600 | $191,800 | $152,800 |
| 2019 | $2,074 | $336,200 | $204,200 | $132,000 |
| 2018 | $1,985 | $313,100 | $194,400 | $118,700 |
| 2017 | $1,831 | $297,700 | $179,000 | $118,700 |
| 2016 | $1,742 | $266,700 | $168,800 | $97,900 |
| 2015 | $1,707 | $266,700 | $168,800 | $97,900 |
| 2014 | $1,897 | $298,800 | $158,600 | $140,200 |
Source: Public Records
Map
Nearby Homes
- 102 Sea St
- 22 Ferncliff Rd
- 402 Old Wharf Rd
- 402 Old Wharf Rd
- 37-A Beach Hills Rd
- 405 Old Wharf Rd Unit B204
- 405 Old Wharf Rd Unit B204
- 37 Beach Hills Rd
- 11 Ocean Park W
- 9 Chase Ave Unit 6
- 262 Old Wharf Rd Unit 67
- 262 Old Wharf Rd Unit 5
- 262 Old Wharf Rd Unit 5
- 262 Old Wharf Rd Unit 20
- 262 Old Wharf Rd Unit 87
- 12 Cross St
- 26 Manning Rd
- 241 Old Wharf Rd Unit 82
- 241 Old Wharf Rd Unit 127
- 241 Old Wharf Rd Unit 90
- 52 Arbor Way
- 52 Arbor Way Unit 6,7
- 52 Arbor Way Unit CD
- 87 Sea St
- 81 Sea St
- 81 Sea St
- 48 Arbor Way
- 48 Arbor Way Unit AB
- 48 Arbor Way Unit 4 & 5
- 38 Arbor Way Unit 40
- 38 Arbor Way Unit 40
- 38 Arbor Way Unit 40
- 38 Arbor Way Unit 40
- 38 Arbor Way Unit 40
- 38 Arbor Way Unit 40
- 38 Arbor Way Unit 10A
- 38 Arbor Way Unit 8
- 38 Arbor Way Unit 1
- 38 Arbor Way Unit 3
- 38 Arbor Way Unit 2