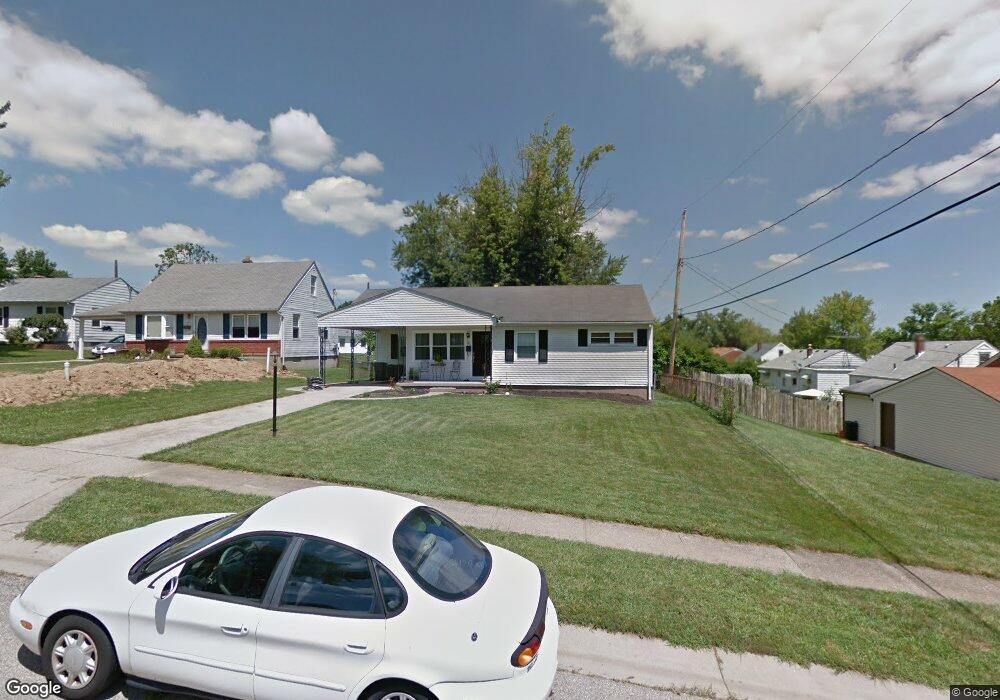
50 Berkshire Ct Hamilton, OH 45013
Estimated Value: $215,000 - $228,712
3
Beds
2
Baths
1,670
Sq Ft
$133/Sq Ft
Est. Value
About This Home
This home is located at 50 Berkshire Ct, Hamilton, OH 45013 and is currently estimated at $221,428, approximately $132 per square foot. 50 Berkshire Ct is a home located in Butler County with nearby schools including Brookwood Elementary School, Wilson Middle School, and Hamilton High School Main Campus.
Ownership History
Date
Name
Owned For
Owner Type
Purchase Details
Closed on
Sep 11, 2020
Sold by
Lynn Milligan Kimberly
Bought by
Farley Brittany M
Current Estimated Value
Home Financials for this Owner
Home Financials are based on the most recent Mortgage that was taken out on this home.
Original Mortgage
$137,744
Outstanding Balance
$122,239
Interest Rate
2.9%
Mortgage Type
FHA
Estimated Equity
$99,189
Purchase Details
Closed on
Jan 24, 2005
Sold by
Young Richard E and Young Oma C
Bought by
Newton Joshua J and Newton Kimberly L
Home Financials for this Owner
Home Financials are based on the most recent Mortgage that was taken out on this home.
Original Mortgage
$102,150
Interest Rate
5.77%
Mortgage Type
VA
Purchase Details
Closed on
Oct 7, 1996
Sold by
Beatrice Gray Est
Bought by
Young Richard E and Gerlach Oma
Home Financials for this Owner
Home Financials are based on the most recent Mortgage that was taken out on this home.
Original Mortgage
$78,630
Interest Rate
8%
Mortgage Type
FHA
Create a Home Valuation Report for This Property
The Home Valuation Report is an in-depth analysis detailing your home's value as well as a comparison with similar homes in the area
Home Values in the Area
Average Home Value in this Area
Purchase History
| Date | Buyer | Sale Price | Title Company |
|---|---|---|---|
| Farley Brittany M | $142,550 | Redhawk Title | |
| Newton Joshua J | $100,000 | -- | |
| Young Richard E | $84,900 | -- |
Source: Public Records
Mortgage History
| Date | Status | Borrower | Loan Amount |
|---|---|---|---|
| Open | Farley Brittany M | $137,744 | |
| Previous Owner | Newton Joshua J | $102,150 | |
| Previous Owner | Young Richard E | $78,630 |
Source: Public Records
Tax History Compared to Growth
Tax History
| Year | Tax Paid | Tax Assessment Tax Assessment Total Assessment is a certain percentage of the fair market value that is determined by local assessors to be the total taxable value of land and additions on the property. | Land | Improvement |
|---|---|---|---|---|
| 2024 | $2,373 | $56,230 | $9,090 | $47,140 |
| 2023 | $2,362 | $57,310 | $9,090 | $48,220 |
| 2022 | $1,975 | $39,750 | $9,090 | $30,660 |
| 2021 | $1,742 | $38,460 | $9,090 | $29,370 |
| 2020 | $1,814 | $38,460 | $9,090 | $29,370 |
| 2019 | $1,515 | $31,740 | $8,240 | $23,500 |
| 2018 | $1,475 | $31,740 | $8,240 | $23,500 |
| 2017 | $1,488 | $31,740 | $8,240 | $23,500 |
| 2016 | $1,424 | $28,950 | $8,240 | $20,710 |
| 2015 | $1,416 | $28,950 | $8,240 | $20,710 |
| 2014 | $1,609 | $28,950 | $8,240 | $20,710 |
| 2013 | $1,609 | $35,020 | $8,240 | $26,780 |
Source: Public Records
Map
Nearby Homes
- 560 Springvale Dr
- 16 Rockford Dr
- 885 Carlisle Ave
- 781 Springvale Dr
- 1350 Stahlheber Rd
- 2073 Sunset Dr
- 399 Rockford Dr
- 1415 Main St
- 65 W Persimmon Dr
- 238 Twinbrook Dr
- 1063 Westview Ave
- 124 Twinbrook Dr
- 82 N Brookwood Ave
- 1241 Millville Ave
- 1281 Millville Ave
- 413 Smalley Blvd
- 411 Smalley Blvd
- 419 Smalley Blvd
- 1317 Glenbrook Dr
- 1317 Goodman Ave
- 60 Berkshire Ct
- 925 Armistead Dr
- 30 Berkshire Ct
- 935 Armistead Dr
- 70 Berkshire Ct
- 80 Beverly Dr
- 945 Armistead Dr
- 84 Beverly Dr
- 25 Berkshire Ct
- 80 Berkshire Ct
- 55 Berkshire Ct
- 955 Armistead Dr
- 65 Berkshire Ct
- 68 Beverly Dr
- 895 Armistead Dr
- 924 Armistead Dr
- 88 Beverly Dr
- 60 Beverly Dr
- 90 Berkshire Ct
- 965 Armistead Dr