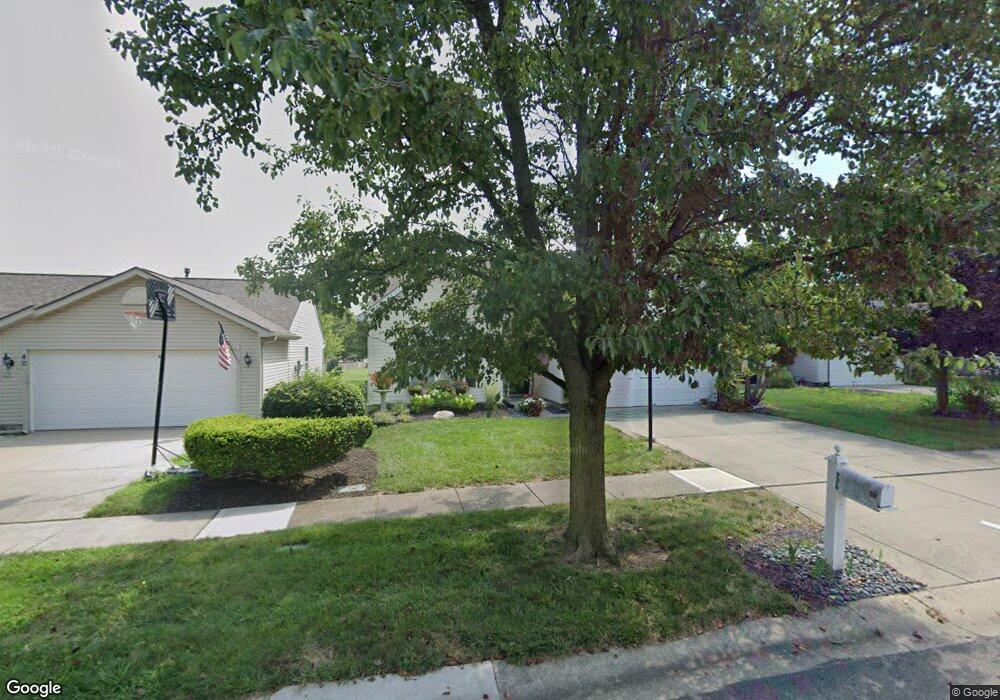
50 Blose Ct Springboro, OH 45066
Estimated Value: $270,000 - $299,000
3
Beds
2
Baths
1,326
Sq Ft
$217/Sq Ft
Est. Value
About This Home
This home is located at 50 Blose Ct, Springboro, OH 45066 and is currently estimated at $287,217, approximately $216 per square foot. 50 Blose Ct is a home located in Montgomery County with nearby schools including Clearcreek Elementary School, Springboro Intermediate School, and Springboro Junior High School.
Ownership History
Date
Name
Owned For
Owner Type
Purchase Details
Closed on
Aug 4, 2022
Sold by
Reyes David Torres and Ninotchska Delvalle
Bought by
Roberts Michael and Ormes Paula
Current Estimated Value
Home Financials for this Owner
Home Financials are based on the most recent Mortgage that was taken out on this home.
Original Mortgage
$232,750
Outstanding Balance
$221,206
Interest Rate
5.3%
Mortgage Type
New Conventional
Estimated Equity
$66,011
Purchase Details
Closed on
Feb 7, 2019
Sold by
Mcleod Douglas C
Bought by
Delvalle Reyes David Torres and Delvalle Dorta Ninotchska
Home Financials for this Owner
Home Financials are based on the most recent Mortgage that was taken out on this home.
Original Mortgage
$146,700
Interest Rate
4.4%
Mortgage Type
New Conventional
Purchase Details
Closed on
Jun 16, 2017
Sold by
Kuehl Christian John and Kuehl Lyndsey R
Bought by
Mcleod Douglas C
Home Financials for this Owner
Home Financials are based on the most recent Mortgage that was taken out on this home.
Original Mortgage
$127,200
Interest Rate
3.9%
Mortgage Type
New Conventional
Purchase Details
Closed on
Jun 26, 2013
Sold by
Robinett Joshua R and Robinett Rebecca E
Bought by
Kuehl Christian John and Kuehl Lyndsey R
Home Financials for this Owner
Home Financials are based on the most recent Mortgage that was taken out on this home.
Original Mortgage
$137,464
Interest Rate
3.75%
Mortgage Type
FHA
Purchase Details
Closed on
Jul 21, 2006
Sold by
Greenwood Kimberly Anne
Bought by
Robinett Joshua R and Robinett Rebecca E
Home Financials for this Owner
Home Financials are based on the most recent Mortgage that was taken out on this home.
Original Mortgage
$162,352
Interest Rate
6.82%
Mortgage Type
FHA
Purchase Details
Closed on
Sep 10, 2003
Sold by
Crone Ryan J and Crone Lori A
Bought by
Greenwood Kimberly Anne
Home Financials for this Owner
Home Financials are based on the most recent Mortgage that was taken out on this home.
Original Mortgage
$139,580
Interest Rate
6.44%
Mortgage Type
Purchase Money Mortgage
Purchase Details
Closed on
Sep 15, 1998
Sold by
Nvr Homes Inc
Bought by
Crone Ryan J and Crone Lori A
Home Financials for this Owner
Home Financials are based on the most recent Mortgage that was taken out on this home.
Original Mortgage
$111,350
Interest Rate
7.02%
Create a Home Valuation Report for This Property
The Home Valuation Report is an in-depth analysis detailing your home's value as well as a comparison with similar homes in the area
Purchase History
| Date | Buyer | Sale Price | Title Company |
|---|---|---|---|
| Roberts Michael | $245,000 | None Listed On Document | |
| Delvalle Reyes David Torres | $165,000 | Fidelity Lawyers Title Agenc | |
| Mcleod Douglas C | $159,000 | Chicago Title Company Llc | |
| Kuehl Christian John | $140,000 | Landmark Title Agency South | |
| Robinett Joshua R | $164,900 | First American Title Ins Co | |
| Greenwood Kimberly Anne | $143,900 | -- | |
| Crone Ryan J | $117,300 | -- |
Source: Public Records
Mortgage History
| Date | Status | Borrower | Loan Amount |
|---|---|---|---|
| Open | Roberts Michael | $232,750 | |
| Previous Owner | Delvalle Reyes David Torres | $146,700 | |
| Previous Owner | Mcleod Douglas C | $127,200 | |
| Previous Owner | Kuehl Christian John | $137,464 | |
| Previous Owner | Robinett Joshua R | $162,352 | |
| Previous Owner | Greenwood Kimberly Anne | $139,580 | |
| Previous Owner | Crone Ryan J | $111,350 |
Source: Public Records
Tax History
| Year | Tax Paid | Tax Assessment Tax Assessment Total Assessment is a certain percentage of the fair market value that is determined by local assessors to be the total taxable value of land and additions on the property. | Land | Improvement |
|---|---|---|---|---|
| 2025 | $3,919 | $76,320 | $21,870 | $54,450 |
| 2024 | $3,971 | $76,320 | $21,870 | $54,450 |
| 2023 | $3,971 | $76,320 | $21,870 | $54,450 |
| 2022 | $3,051 | $53,750 | $15,400 | $38,350 |
| 2021 | $3,056 | $53,750 | $15,400 | $38,350 |
| 2020 | $3,166 | $53,750 | $15,400 | $38,350 |
| 2019 | $2,500 | $43,170 | $14,000 | $29,170 |
| 2018 | $2,507 | $43,170 | $14,000 | $29,170 |
| 2017 | $2,657 | $43,170 | $14,000 | $29,170 |
| 2016 | $2,595 | $40,880 | $14,000 | $26,880 |
| 2015 | $2,647 | $40,880 | $14,000 | $26,880 |
| 2014 | $2,647 | $40,880 | $14,000 | $26,880 |
| 2012 | -- | $44,710 | $14,000 | $30,710 |
Source: Public Records
Map
Nearby Homes
- 25 Blose Ct
- 33 Christman Dr
- 5 Orville Ct
- 217 Meadow Dr
- 165 Meadows Dr
- 80 Villa Pointe Dr
- 80 Gregg Ct
- 250 Ballard Dr
- 10084 Gully Pass Dr Unit 248
- 10084 Gully Pass Dr
- 2002 Glen Valley Dr
- 2005 Glen Valley Dr Unit 210
- 2005 Glen Valley Dr
- 10010 Washington Glen Dr
- 10109 Gully Pass Dr Unit 250
- 10213 Gully Pass Dr Unit 251
- 123 Rippling Brook Ln
- 182 Rippling Brook Ln
- 160 Old Pond Rd
- 141 Old Pond Rd
Your Personal Tour Guide
Ask me questions while you tour the home.