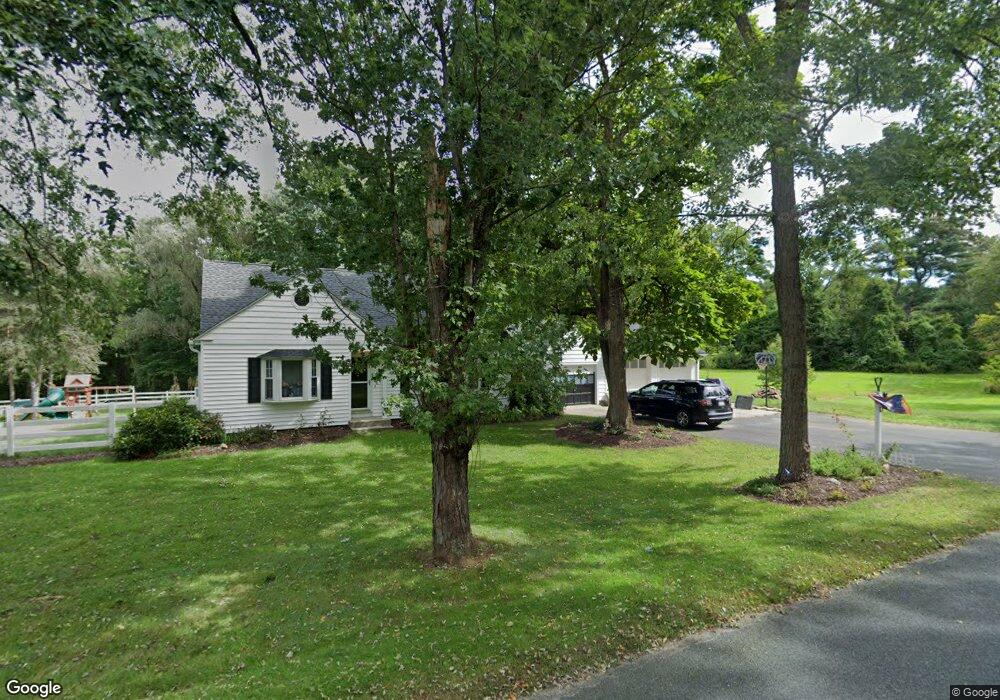
50 Bogan Rd Monson, MA 01057
Estimated Value: $360,629 - $484,000
3
Beds
1
Bath
1,494
Sq Ft
$279/Sq Ft
Est. Value
About This Home
This home is located at 50 Bogan Rd, Monson, MA 01057 and is currently estimated at $417,407, approximately $279 per square foot. 50 Bogan Rd is a home located in Hampden County with nearby schools including Quarry Hill Community School, Granite Valley School, and Monson High School.
Ownership History
Date
Name
Owned For
Owner Type
Purchase Details
Closed on
Oct 26, 2012
Sold by
American Home Mtg Svcn
Bought by
Dodge Nicole
Current Estimated Value
Home Financials for this Owner
Home Financials are based on the most recent Mortgage that was taken out on this home.
Original Mortgage
$197,344
Outstanding Balance
$140,379
Interest Rate
4.25%
Mortgage Type
FHA
Estimated Equity
$277,028
Purchase Details
Closed on
May 18, 2005
Sold by
Kwasnik Joseph J
Bought by
Kwasnik Agnes and Kwasnik Joseph J
Home Financials for this Owner
Home Financials are based on the most recent Mortgage that was taken out on this home.
Original Mortgage
$130,000
Interest Rate
5.95%
Mortgage Type
Purchase Money Mortgage
Purchase Details
Closed on
Apr 11, 1995
Sold by
Kwasnik Stanley A
Bought by
Kwasnik Joseph E and Kwasnik Joseph J
Create a Home Valuation Report for This Property
The Home Valuation Report is an in-depth analysis detailing your home's value as well as a comparison with similar homes in the area
Home Values in the Area
Average Home Value in this Area
Purchase History
| Date | Buyer | Sale Price | Title Company |
|---|---|---|---|
| Dodge Nicole | $179,000 | -- | |
| Kwasnik Agnes | -- | -- | |
| Kwasnik Joseph E | $18,316 | -- |
Source: Public Records
Mortgage History
| Date | Status | Borrower | Loan Amount |
|---|---|---|---|
| Open | Dodge Nicole | $197,344 | |
| Previous Owner | Kwasnik Agnes | $130,000 | |
| Previous Owner | Kwasnik Joseph E | $60,000 |
Source: Public Records
Tax History Compared to Growth
Tax History
| Year | Tax Paid | Tax Assessment Tax Assessment Total Assessment is a certain percentage of the fair market value that is determined by local assessors to be the total taxable value of land and additions on the property. | Land | Improvement |
|---|---|---|---|---|
| 2025 | $4,721 | $317,500 | $69,800 | $247,700 |
| 2024 | $4,583 | $295,700 | $69,800 | $225,900 |
| 2023 | $4,170 | $262,900 | $69,800 | $193,100 |
| 2022 | $4,021 | $225,500 | $69,800 | $155,700 |
| 2021 | $3,745 | $206,700 | $69,800 | $136,900 |
| 2020 | $3,776 | $206,700 | $69,800 | $136,900 |
| 2019 | $0 | $197,400 | $69,800 | $127,600 |
| 2018 | $3,494 | $198,500 | $77,200 | $121,300 |
| 2017 | $0 | $190,700 | $74,000 | $116,700 |
| 2016 | $3,350 | $195,700 | $74,100 | $121,600 |
| 2015 | $3,236 | $194,100 | $74,100 | $120,000 |
| 2014 | $3,144 | $194,100 | $74,100 | $120,000 |
Source: Public Records
Map
Nearby Homes
- 0 Paradise Lake Rd
- 6 Bridge St
- 285 Lower Hampden Rd
- 101 Cote Rd
- Lot 16 Wood Hill Rd
- 179 Bumstead Rd
- 0 Mccray Cir
- 21 High St
- 23 High St
- 1 Heritage Ln
- 4 Spring St
- 4 Stewart Ave
- 56 Margaret St
- 18 Palmer Rd Unit 15
- 18 Palmer Rd Unit 6
- 0 Brimfield Rd
- Lot B Brimfield Rd
- 186 Upper Hampden Rd
- 26 Brimfield Rd
- 12 Upper Palmer Rd