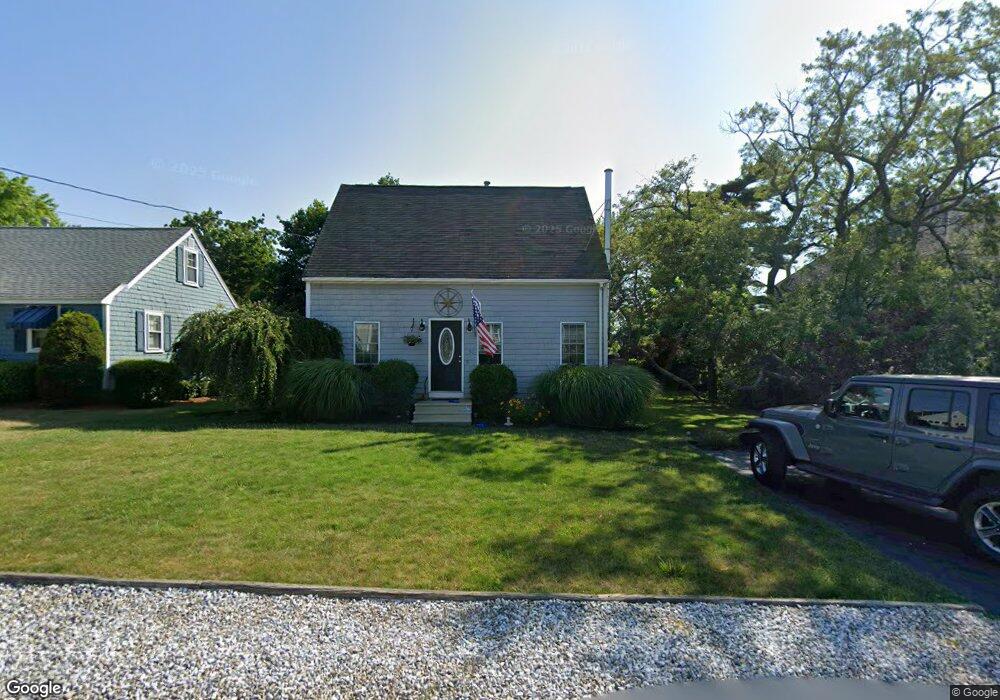
50 Bradley St Marshfield, MA 02050
Ocean Bluff-Brant Rock NeighborhoodEstimated Value: $658,000 - $801,000
3
Beds
2
Baths
1,354
Sq Ft
$552/Sq Ft
Est. Value
About This Home
This home is located at 50 Bradley St, Marshfield, MA 02050 and is currently estimated at $747,217, approximately $551 per square foot. 50 Bradley St is a home located in Plymouth County with nearby schools including Governor Edward Winslow School, Furnace Brook Middle School, and Marshfield High School.
Ownership History
Date
Name
Owned For
Owner Type
Purchase Details
Closed on
May 18, 2016
Sold by
Mcevoy Steven A and Mcevoy Donna J
Bought by
Mcevoy Steven A
Current Estimated Value
Purchase Details
Closed on
Apr 6, 2015
Sold by
Mcevoy Steven A
Bought by
Mcevoy Steven A and Mcevoy Donna J
Purchase Details
Closed on
Dec 11, 1998
Sold by
Cadigan Jill Ar and Cadigan Neil J
Bought by
Mcevoy Steven A
Home Financials for this Owner
Home Financials are based on the most recent Mortgage that was taken out on this home.
Original Mortgage
$127,454
Interest Rate
6.8%
Mortgage Type
Purchase Money Mortgage
Purchase Details
Closed on
Feb 9, 1998
Sold by
Deely Edward G
Bought by
Cadigan Jill A and Christenson Donald T
Create a Home Valuation Report for This Property
The Home Valuation Report is an in-depth analysis detailing your home's value as well as a comparison with similar homes in the area
Home Values in the Area
Average Home Value in this Area
Purchase History
| Date | Buyer | Sale Price | Title Company |
|---|---|---|---|
| Mcevoy Steven A | -- | -- | |
| Mcevoy Steven A | -- | -- | |
| Mcevoy Steven A | -- | -- | |
| Mcevoy Steven A | -- | -- | |
| Mcevoy Steven A | $131,000 | -- | |
| Cadigan Jill A | $93,000 | -- | |
| Mcevoy Steven A | -- | -- | |
| Mcevoy Steven A | -- | -- | |
| Mcevoy Steven A | $131,000 | -- | |
| Cadigan Jill A | $93,000 | -- |
Source: Public Records
Mortgage History
| Date | Status | Borrower | Loan Amount |
|---|---|---|---|
| Previous Owner | Cadigan Jill A | $30,000 | |
| Previous Owner | Cadigan Jill A | $127,454 |
Source: Public Records
Tax History
| Year | Tax Paid | Tax Assessment Tax Assessment Total Assessment is a certain percentage of the fair market value that is determined by local assessors to be the total taxable value of land and additions on the property. | Land | Improvement |
|---|---|---|---|---|
| 2025 | $6,913 | $698,300 | $377,200 | $321,100 |
| 2024 | $6,684 | $643,300 | $357,300 | $286,000 |
| 2023 | $5,925 | $557,400 | $309,700 | $247,700 |
| 2022 | $5,925 | $457,500 | $248,100 | $209,400 |
| 2021 | $5,746 | $435,600 | $248,100 | $187,500 |
| 2020 | $5,807 | $435,600 | $248,100 | $187,500 |
| 2019 | $5,670 | $423,800 | $248,100 | $175,700 |
| 2018 | $5,023 | $375,700 | $208,400 | $167,300 |
| 2017 | $4,846 | $353,200 | $208,400 | $144,800 |
| 2016 | $4,809 | $346,500 | $208,400 | $138,100 |
| 2015 | $4,463 | $335,800 | $198,500 | $137,300 |
| 2014 | $4,483 | $337,300 | $208,400 | $128,900 |
Source: Public Records
Map
Nearby Homes
Your Personal Tour Guide
Ask me questions while you tour the home.