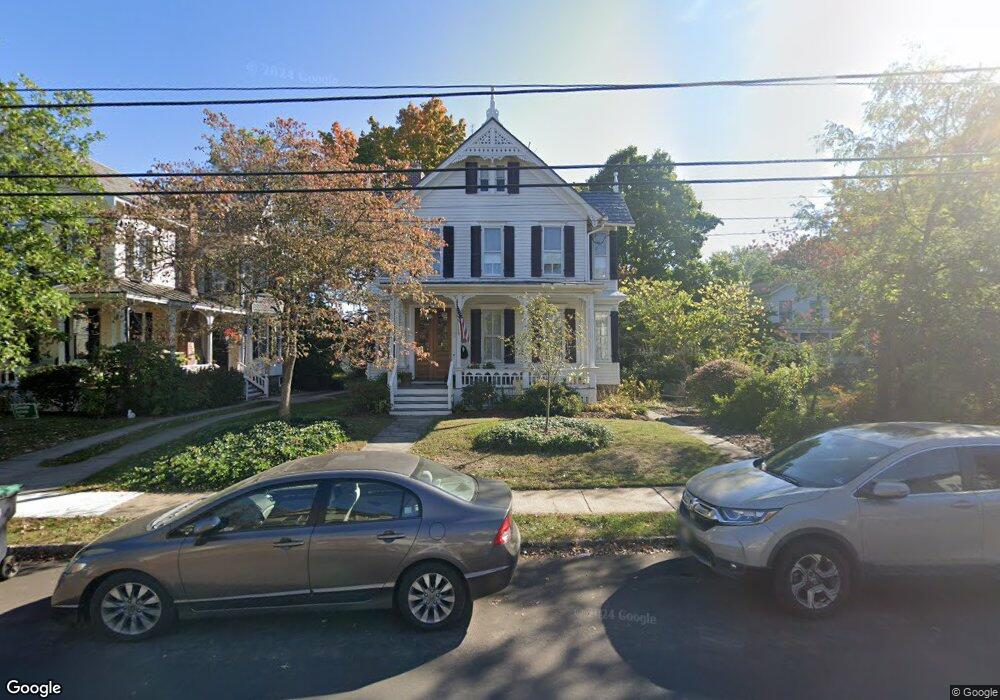
50 Broad St Flemington, NJ 08822
Estimated Value: $602,000 - $650,000
Studio
--
Bath
2,747
Sq Ft
$228/Sq Ft
Est. Value
About This Home
This home is located at 50 Broad St, Flemington, NJ 08822 and is currently estimated at $626,282, approximately $227 per square foot. 50 Broad St is a home located in Hunterdon County with nearby schools including Francis A. Desmares Elementary School, Reading Fleming Intermediate School, and J.P. Case Middle School.
Ownership History
Date
Name
Owned For
Owner Type
Purchase Details
Closed on
Jun 12, 1999
Sold by
Broadright Douglas G
Bought by
Morgan Daniel and Giardinere Judith
Current Estimated Value
Home Financials for this Owner
Home Financials are based on the most recent Mortgage that was taken out on this home.
Original Mortgage
$229,000
Outstanding Balance
$62,589
Interest Rate
7.49%
Estimated Equity
$563,693
Purchase Details
Closed on
Aug 15, 1997
Sold by
Crowl Peter
Bought by
Broadright Douglas and Broadright Gail
Home Financials for this Owner
Home Financials are based on the most recent Mortgage that was taken out on this home.
Original Mortgage
$174,000
Interest Rate
7.56%
Create a Home Valuation Report for This Property
The Home Valuation Report is an in-depth analysis detailing your home's value as well as a comparison with similar homes in the area
Home Values in the Area
Average Home Value in this Area
Purchase History
We collect this data history from publicly available records. To have your information removed, we recommend requesting removal directly through your county’s website.
| Date | Buyer | Sale Price | Title Company |
|---|---|---|---|
| Morgan Daniel | $309,000 | -- | |
| Broadright Douglas | $217,000 | -- |
Source: Public Records
Mortgage History
We collect this data history from publicly available records. To have your information removed, we recommend requesting removal directly through your county’s website.
| Date | Status | Borrower | Loan Amount |
|---|---|---|---|
| Open | Morgan Daniel | $229,000 | |
| Previous Owner | Broadright Douglas | $174,000 |
Source: Public Records
Tax History
| Year | Tax Paid | Tax Assessment Tax Assessment Total Assessment is a certain percentage of the fair market value that is determined by local assessors to be the total taxable value of land and additions on the property. | Land | Improvement |
|---|---|---|---|---|
| 2025 | $13,689 | $520,400 | $119,900 | $400,500 |
| 2024 | $13,224 | $486,100 | $111,000 | $375,100 |
| 2023 | $13,224 | $456,000 | $103,700 | $352,300 |
| 2022 | $13,046 | $433,000 | $95,900 | $337,100 |
| 2021 | $12,546 | $414,800 | $90,400 | $324,400 |
| 2020 | $12,941 | $407,200 | $90,400 | $316,800 |
| 2019 | $12,546 | $403,400 | $89,100 | $314,300 |
| 2018 | $11,959 | $390,700 | $87,400 | $303,300 |
| 2017 | $11,755 | $380,900 | $87,400 | $293,500 |
| 2016 | $11,728 | $373,500 | $87,400 | $286,100 |
| 2015 | $11,181 | $366,100 | $87,400 | $278,700 |
| 2014 | $10,650 | $358,700 | $87,400 | $271,300 |
Source: Public Records
Map
Nearby Homes
- 37 Broad St
- 22 Broad St
- 44 Maple Ave
- 6 Highland Ave
- 25 Park Ave
- 13 William St
- 92 Park Ave
- 30 Capner St
- 12 Corcoran St
- 6 William Martin Way Unit II6
- 312 George Wilson Blvd
- 58 N Main St
- 175 Main St
- 29 Royal Rd
- 237A S Main St Unit A
- 237A S Main St
- 237B S Main St
- 18 Kentworth Ct
- 24 Kentworth Ct
- 123 Thatchers Hill Rd
Your Personal Tour Guide
Ask me questions while you tour the home.