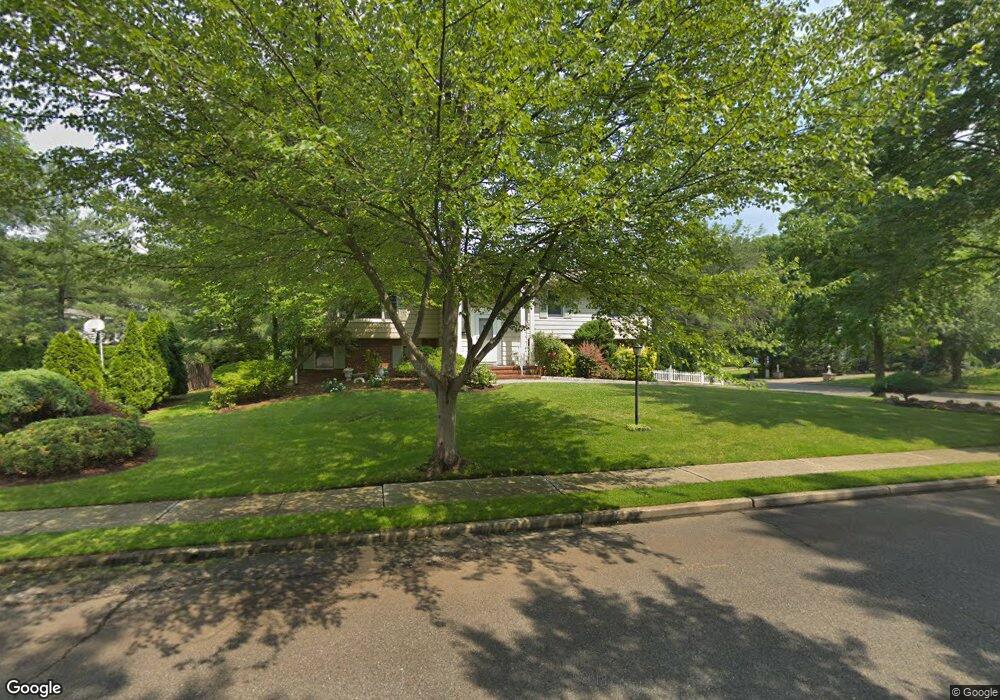
50 Brown Cir Paramus, NJ 07652
Estimated Value: $974,511 - $1,199,000
--
Bed
--
Bath
2,356
Sq Ft
$456/Sq Ft
Est. Value
About This Home
This home is located at 50 Brown Cir, Paramus, NJ 07652 and is currently estimated at $1,073,378, approximately $455 per square foot. 50 Brown Cir is a home located in Bergen County with nearby schools including Paramus High School, St. Peter Academy, and Ben Porat Yosef.
Ownership History
Date
Name
Owned For
Owner Type
Purchase Details
Closed on
Sep 18, 2007
Sold by
Kim Tai Ho and Kim Sook Yeon
Bought by
Mustafa Mustafa A and Said Raghad H
Current Estimated Value
Home Financials for this Owner
Home Financials are based on the most recent Mortgage that was taken out on this home.
Original Mortgage
$499,000
Outstanding Balance
$316,256
Interest Rate
6.59%
Mortgage Type
New Conventional
Estimated Equity
$757,122
Purchase Details
Closed on
May 30, 1996
Sold by
Rangel Alberto and Rangel Teresita
Bought by
Kim Tai Ho and Sook Yeon Kim +
Home Financials for this Owner
Home Financials are based on the most recent Mortgage that was taken out on this home.
Original Mortgage
$200,000
Interest Rate
8.21%
Create a Home Valuation Report for This Property
The Home Valuation Report is an in-depth analysis detailing your home's value as well as a comparison with similar homes in the area
Home Values in the Area
Average Home Value in this Area
Purchase History
| Date | Buyer | Sale Price | Title Company |
|---|---|---|---|
| Mustafa Mustafa A | $675,000 | -- | |
| Kim Tai Ho | $335,000 | -- |
Source: Public Records
Mortgage History
| Date | Status | Borrower | Loan Amount |
|---|---|---|---|
| Open | Mustafa Mustafa A | $499,000 | |
| Previous Owner | Kim Tai Ho | $200,000 |
Source: Public Records
Tax History Compared to Growth
Tax History
| Year | Tax Paid | Tax Assessment Tax Assessment Total Assessment is a certain percentage of the fair market value that is determined by local assessors to be the total taxable value of land and additions on the property. | Land | Improvement |
|---|---|---|---|---|
| 2025 | $10,737 | $755,900 | $408,100 | $347,800 |
| 2024 | $10,433 | $709,200 | $377,600 | $331,600 |
| 2023 | $9,894 | $680,100 | $359,900 | $320,200 |
| 2022 | $9,894 | $637,500 | $335,700 | $301,800 |
| 2021 | $9,730 | $588,300 | $310,200 | $278,100 |
| 2020 | $9,249 | $579,900 | $305,200 | $274,700 |
| 2019 | $11,297 | $608,700 | $361,200 | $247,500 |
| 2018 | $11,157 | $608,700 | $361,200 | $247,500 |
| 2017 | $10,963 | $608,700 | $361,200 | $247,500 |
| 2016 | $10,664 | $608,700 | $361,200 | $247,500 |
| 2015 | $10,555 | $608,700 | $361,200 | $247,500 |
| 2014 | $10,464 | $608,700 | $361,200 | $247,500 |
Source: Public Records
Map
Nearby Homes
- 42 Eastbrook Dr
- 16 Coles Ct
- 327 van Saun Dr
- 192 Valley Rd
- 56 Lilac Ln
- 187 Crest Dr
- 183 Oak Ave
- 302 Howland Ave
- 171 Brookfield Ave
- 122 Village Cir E
- 165 Mohawk Dr
- 150 Village Cir E
- 214 Zabriskie Place
- 222 Zabriskie Place
- 131 Davis Ave
- 811 Summit Ave
- 824 Summit Ave
- 104 Trinity Ct
- 12 Gainesborough Terrace Unit 1B
- 421 Lafayette Ave