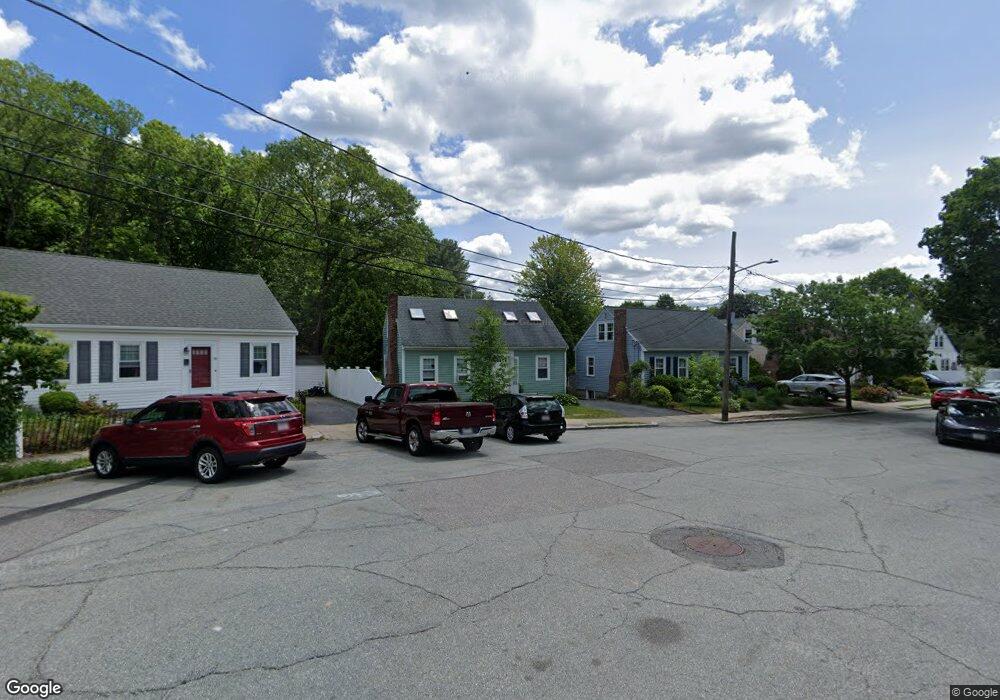
50 Bryant Rd Unit 4 West Roxbury, MA 02132
Harbor View-Orient Heights NeighborhoodEstimated Value: $399,000 - $410,000
2
Beds
1
Bath
786
Sq Ft
$518/Sq Ft
Est. Value
About This Home
This home is located at 50 Bryant Rd Unit 4, West Roxbury, MA 02132 and is currently estimated at $406,975, approximately $517 per square foot. 50 Bryant Rd Unit 4 is a home located in Suffolk County with nearby schools including Excel Academy East Boston, Brooke Charter Schools East Boston, and East Boston Montessori School.
Ownership History
Date
Name
Owned For
Owner Type
Purchase Details
Closed on
Feb 10, 2003
Sold by
Fallon Katherine
Bought by
Chan Aldyecher-Chu
Current Estimated Value
Home Financials for this Owner
Home Financials are based on the most recent Mortgage that was taken out on this home.
Original Mortgage
$135,000
Outstanding Balance
$57,986
Interest Rate
5.99%
Mortgage Type
Purchase Money Mortgage
Estimated Equity
$348,989
Purchase Details
Closed on
Dec 3, 1996
Sold by
Yong Jason
Bought by
Fallon Katherine
Home Financials for this Owner
Home Financials are based on the most recent Mortgage that was taken out on this home.
Original Mortgage
$66,500
Interest Rate
7.82%
Mortgage Type
Purchase Money Mortgage
Purchase Details
Closed on
Dec 31, 1991
Sold by
Sneider Norman and Sneider Harriet
Bought by
Yong Jason
Home Financials for this Owner
Home Financials are based on the most recent Mortgage that was taken out on this home.
Original Mortgage
$51,900
Interest Rate
8.62%
Mortgage Type
Purchase Money Mortgage
Create a Home Valuation Report for This Property
The Home Valuation Report is an in-depth analysis detailing your home's value as well as a comparison with similar homes in the area
Home Values in the Area
Average Home Value in this Area
Purchase History
| Date | Buyer | Sale Price | Title Company |
|---|---|---|---|
| Chan Aldyecher-Chu | $180,000 | -- | |
| Fallon Katherine | $70,000 | -- | |
| Yong Jason | $64,900 | -- |
Source: Public Records
Mortgage History
| Date | Status | Borrower | Loan Amount |
|---|---|---|---|
| Open | Yong Jason | $135,000 | |
| Previous Owner | Yong Jason | $66,500 | |
| Previous Owner | Yong Jason | $51,900 |
Source: Public Records
Tax History Compared to Growth
Tax History
| Year | Tax Paid | Tax Assessment Tax Assessment Total Assessment is a certain percentage of the fair market value that is determined by local assessors to be the total taxable value of land and additions on the property. | Land | Improvement |
|---|---|---|---|---|
| 2025 | $3,808 | $328,800 | $0 | $328,800 |
| 2024 | $3,511 | $322,100 | $0 | $322,100 |
| 2023 | $3,356 | $312,500 | $0 | $312,500 |
| 2022 | $3,239 | $297,700 | $0 | $297,700 |
| 2021 | $3,176 | $297,700 | $0 | $297,700 |
| 2020 | $2,471 | $234,000 | $0 | $234,000 |
| 2019 | $2,305 | $218,700 | $0 | $218,700 |
| 2018 | $2,203 | $210,200 | $0 | $210,200 |
| 2017 | $2,140 | $202,100 | $0 | $202,100 |
| 2016 | $2,078 | $188,900 | $0 | $188,900 |
| 2015 | $2,180 | $180,000 | $0 | $180,000 |
| 2014 | $2,078 | $165,200 | $0 | $165,200 |
Source: Public Records
Map
Nearby Homes
- 31 Wordsworth St
- 95 Addison St Unit 206
- 95 Addison St Unit A
- 10 Wordsworth St
- 7 Wordsworth St Unit 1-101
- 125 Addison St Unit 309
- 125 Addison St Unit 207
- 125 Addison St Unit 8
- 125 Addison St Unit 6
- 580 Bennington St Unit 580
- 795 Saratoga St
- 443 Bennington St
- 528 Bennington St
- 655 Saratoga St Unit 201
- 512 Bennington St
- 106 Moore St Unit PH6
- 106 Moore St Unit PH7
- 106 Moore St Unit 8
- 426 Rear Saratoga St Unit R
- 177 Cowper St
- 50 Bryant Rd Unit 6
- 50 Bryant Rd Unit 5
- 50 Bryant Rd Unit 3
- 50 Bryant Rd Unit 2
- 50 Bryant Rd Unit 1
- 76 Byron St Unit 6
- 76 Byron St Unit 5
- 76 Byron St Unit 4
- 76 Byron St Unit 3
- 76 Byron St Unit 2
- 76 Byron St Unit 1
- 46 Bryant Rd Unit 6
- 46 Bryant Rd Unit 5
- 46 Bryant Rd Unit 4
- 46 Bryant Rd Unit 3
- 46 Bryant Rd Unit 2
- 46 Bryant Rd Unit 1
- 54 Bryant Rd Unit 6
- 54 Bryant Rd Unit 5
- 54 Bryant Rd Unit 4