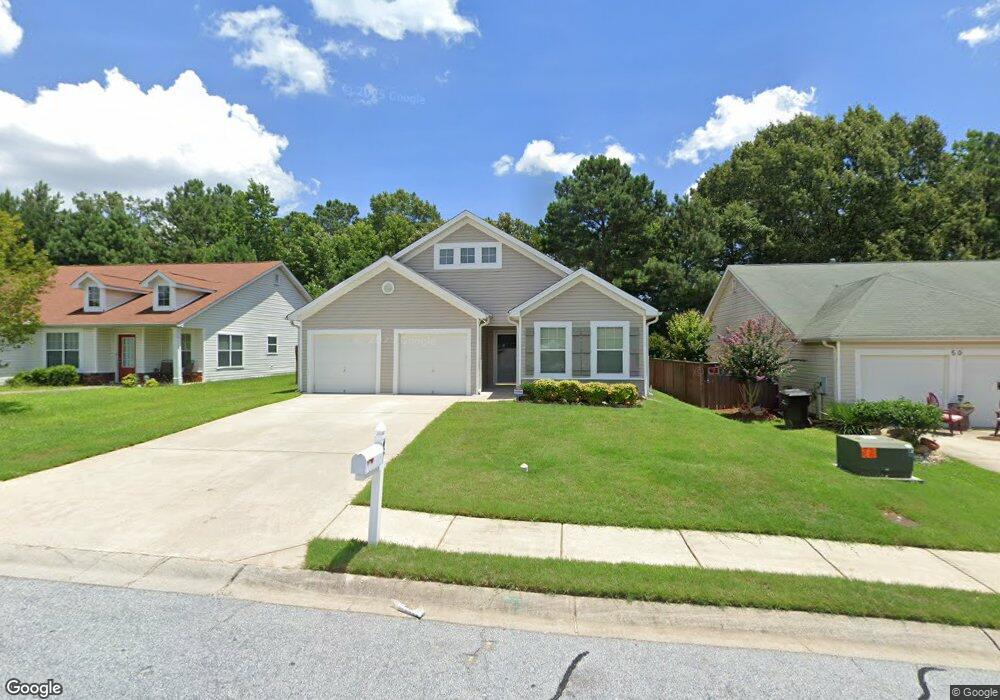
50 Camden Way Fairburn, GA 30213
Estimated Value: $258,000 - $272,487
3
Beds
2
Baths
1,604
Sq Ft
$166/Sq Ft
Est. Value
About This Home
This home is located at 50 Camden Way, Fairburn, GA 30213 and is currently estimated at $266,372, approximately $166 per square foot. 50 Camden Way is a home located in Fulton County with nearby schools including Oakley Elementary School, Bear Creek Middle School, and Creekside High School.
Ownership History
Date
Name
Owned For
Owner Type
Purchase Details
Closed on
Aug 30, 2005
Sold by
Rockport Homes Llc
Bought by
Flores Ralph and Flores Lilia I
Current Estimated Value
Home Financials for this Owner
Home Financials are based on the most recent Mortgage that was taken out on this home.
Original Mortgage
$159,267
Outstanding Balance
$84,081
Interest Rate
5.64%
Mortgage Type
FHA
Estimated Equity
$182,291
Purchase Details
Closed on
Jun 17, 2005
Sold by
Eastport Llc
Bought by
Rockport Homes Llc
Create a Home Valuation Report for This Property
The Home Valuation Report is an in-depth analysis detailing your home's value as well as a comparison with similar homes in the area
Home Values in the Area
Average Home Value in this Area
Purchase History
| Date | Buyer | Sale Price | Title Company |
|---|---|---|---|
| Flores Ralph | $160,600 | -- | |
| Rockport Homes Llc | $160,000 | -- |
Source: Public Records
Mortgage History
| Date | Status | Borrower | Loan Amount |
|---|---|---|---|
| Open | Flores Ralph | $159,267 |
Source: Public Records
Tax History Compared to Growth
Tax History
| Year | Tax Paid | Tax Assessment Tax Assessment Total Assessment is a certain percentage of the fair market value that is determined by local assessors to be the total taxable value of land and additions on the property. | Land | Improvement |
|---|---|---|---|---|
| 2025 | $1,100 | $115,840 | $20,560 | $95,280 |
| 2023 | $3,246 | $115,000 | $26,000 | $89,000 |
| 2022 | $1,066 | $78,720 | $15,120 | $63,600 |
| 2021 | $1,058 | $74,080 | $13,920 | $60,160 |
| 2020 | $1,033 | $64,600 | $11,360 | $53,240 |
| 2019 | $541 | $56,600 | $10,240 | $46,360 |
| 2018 | $962 | $46,200 | $7,840 | $38,360 |
| 2017 | $758 | $37,920 | $6,400 | $31,520 |
| 2016 | $756 | $37,920 | $6,400 | $31,520 |
| 2015 | $759 | $37,920 | $6,400 | $31,520 |
| 2014 | $1,461 | $60,400 | $10,080 | $50,320 |
Source: Public Records
Map
Nearby Homes