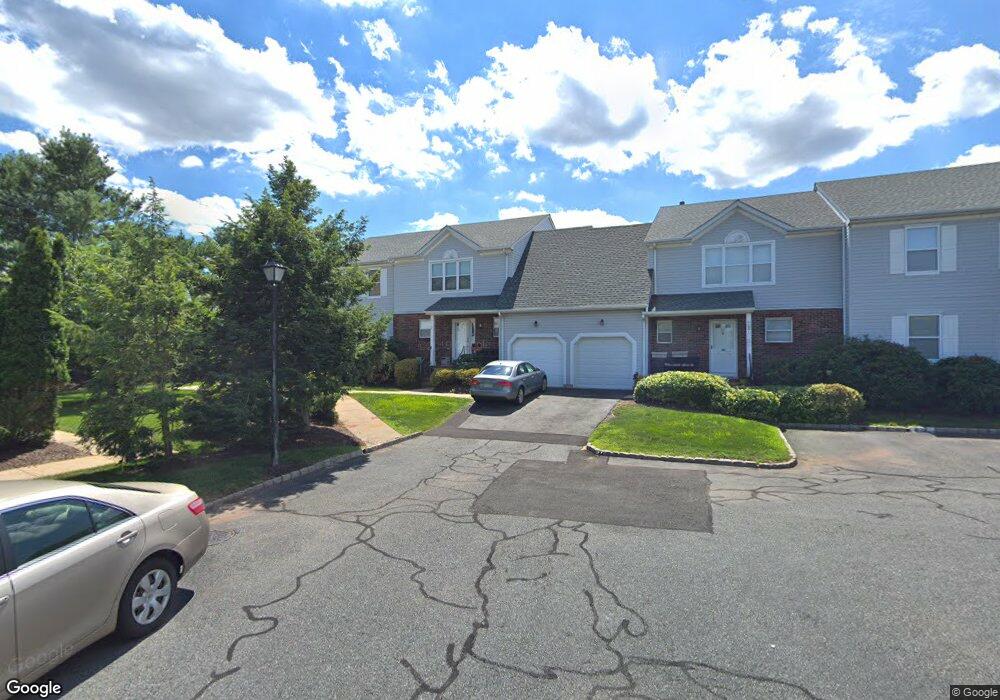
50 Castle Pointe Blvd Piscataway, NJ 08854
Estimated Value: $521,000 - $676,000
--
Bed
--
Bath
1,738
Sq Ft
$332/Sq Ft
Est. Value
About This Home
This home is located at 50 Castle Pointe Blvd, Piscataway, NJ 08854 and is currently estimated at $576,548, approximately $331 per square foot. 50 Castle Pointe Blvd is a home located in Middlesex County with nearby schools including Martin Luther King Intermediate School, Knollwood Elementary School, and Conackamack Middle School.
Ownership History
Date
Name
Owned For
Owner Type
Purchase Details
Closed on
Jun 17, 2020
Sold by
Blaumannn Caplos A and Alonso Mria D
Bought by
Barley Point Investments Llc
Current Estimated Value
Purchase Details
Closed on
Aug 22, 2005
Sold by
Malkus Kurt
Bought by
Blaumann Carlos and Alonso Maria
Home Financials for this Owner
Home Financials are based on the most recent Mortgage that was taken out on this home.
Original Mortgage
$330,000
Interest Rate
5.79%
Create a Home Valuation Report for This Property
The Home Valuation Report is an in-depth analysis detailing your home's value as well as a comparison with similar homes in the area
Home Values in the Area
Average Home Value in this Area
Purchase History
| Date | Buyer | Sale Price | Title Company |
|---|---|---|---|
| Barley Point Investments Llc | $355,000 | Unltas Title Agency Llc | |
| Blaumann Carlos | $412,500 | -- |
Source: Public Records
Mortgage History
| Date | Status | Borrower | Loan Amount |
|---|---|---|---|
| Previous Owner | Blaumann Carlos | $330,000 |
Source: Public Records
Tax History Compared to Growth
Tax History
| Year | Tax Paid | Tax Assessment Tax Assessment Total Assessment is a certain percentage of the fair market value that is determined by local assessors to be the total taxable value of land and additions on the property. | Land | Improvement |
|---|---|---|---|---|
| 2025 | $8,403 | $554,400 | $295,000 | $259,400 |
| 2024 | $8,646 | $429,600 | $175,000 | $254,600 |
| 2023 | $8,646 | $413,700 | $165,000 | $248,700 |
| 2022 | $8,226 | $366,900 | $130,000 | $236,900 |
| 2021 | $8,269 | $342,000 | $130,000 | $212,000 |
| 2020 | $8,269 | $354,600 | $140,000 | $214,600 |
| 2019 | $8,384 | $353,600 | $140,000 | $213,600 |
| 2018 | $8,068 | $341,000 | $140,000 | $201,000 |
| 2017 | $7,715 | $282,200 | $100,000 | $182,200 |
| 2016 | $7,574 | $282,200 | $100,000 | $182,200 |
| 2015 | $7,464 | $282,200 | $100,000 | $182,200 |
| 2014 | $7,281 | $282,200 | $100,000 | $182,200 |
Source: Public Records
Map
Nearby Homes
- 127 Berkshire Ct
- 73 Morris Ave
- 352 Lancaster Ct
- 336 Lancaster Ct Unit 2336
- 21 Thornton Ln
- 18 High Point Way
- 4 Dewey Ct
- 385 Metlars Ln
- 76 Woodland Rd
- 148 Woodland Rd
- 131 Woodland Rd
- 460 Sidney Rd
- 80 Mitchell Ave
- 110 Sylvan Ave
- 400 Rivercrest Dr
- 5 Boxwood Rd
- 206 Overbrook Rd
- 17 Lake Park Dr
- 606 Willow Ave
- 69 Redbud Rd
- 49 Castle Pointe Blvd
- 51 Castle Pointe Blvd
- 52 Castle Pointe Blvd
- 48 Castle Pointe Blvd
- 47 Castle Pointe Blvd
- 53 Castle Pointe Blvd
- 56 Castle Pointe Blvd
- 57 Castle Pointe Blvd Unit 57
- 58 Castle Pointe Blvd
- 1 Canterbury Ct
- 2 Canterbury Ct
- 71 Castle Pointe Blvd
- 70 Castle Pointe Blvd
- 59 Castle Pointe Blvd
- 3 Canterbury Ct Unit C
- 108 Bedford Ct
- 69 Castle Pointe Blvd
- 109 Bedford Ct
- 110 Bedford Ct
- 68 Castle Pointe Blvd