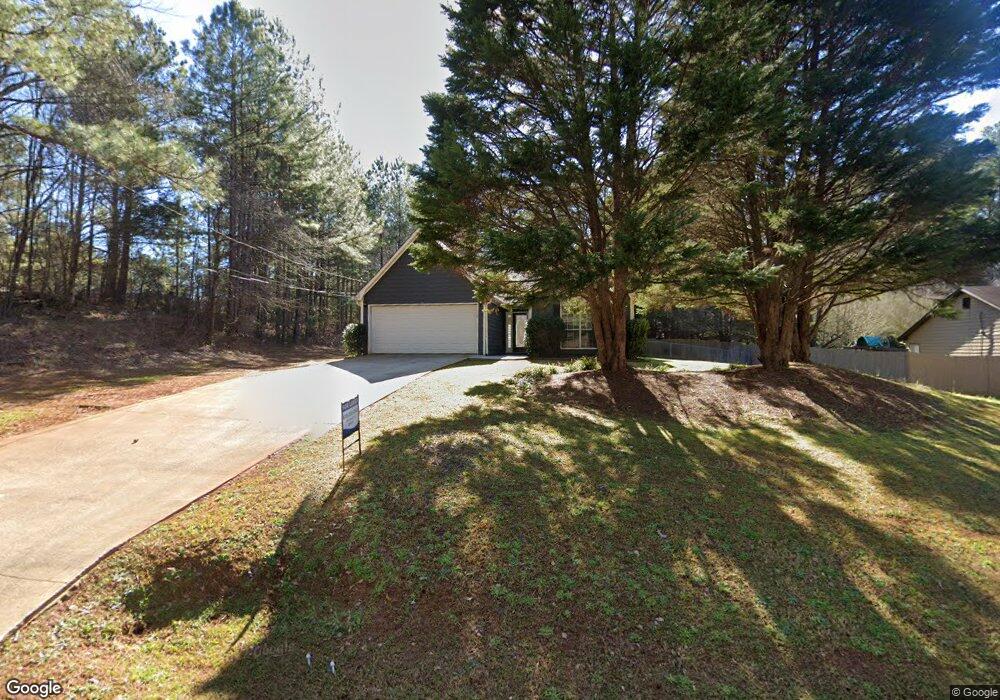
50 Cedar Rd Unit 3 Covington, GA 30016
Estimated Value: $233,701 - $305,000
3
Beds
2
Baths
1,406
Sq Ft
$186/Sq Ft
Est. Value
About This Home
This home is located at 50 Cedar Rd Unit 3, Covington, GA 30016 and is currently estimated at $261,175, approximately $185 per square foot. 50 Cedar Rd Unit 3 is a home located in Newton County with nearby schools including Livingston Elementary School, Liberty Middle School, and Alcovy High School.
Ownership History
Date
Name
Owned For
Owner Type
Purchase Details
Closed on
Apr 23, 2025
Sold by
Rh Partners Ownerco Llc
Bought by
Rh Partners Ownerco 2 Llc
Current Estimated Value
Purchase Details
Closed on
Aug 29, 2024
Sold by
Rh Partners Ownerco Llc
Bought by
Rh Partners Ownerco Llc
Purchase Details
Closed on
Mar 23, 2018
Sold by
Firebird Sfe I Llc
Bought by
Sfr Assets Owner Llc and C/O Main Street Renewal
Purchase Details
Closed on
Aug 7, 2017
Sold by
Suttles James
Bought by
Firebird Sfe I Llc
Purchase Details
Closed on
Nov 17, 2009
Sold by
National Cty Bk
Bought by
Suttles James and Suttles Peggy
Home Financials for this Owner
Home Financials are based on the most recent Mortgage that was taken out on this home.
Original Mortgage
$51,548
Interest Rate
4.98%
Mortgage Type
FHA
Purchase Details
Closed on
Sep 1, 2009
Sold by
Clark Gabriel and Clark Marshell
Bought by
National Cty Bk
Purchase Details
Closed on
Dec 31, 1996
Sold by
Kraft Homesinc
Bought by
Greene Marshall Derrick
Create a Home Valuation Report for This Property
The Home Valuation Report is an in-depth analysis detailing your home's value as well as a comparison with similar homes in the area
Home Values in the Area
Average Home Value in this Area
Purchase History
| Date | Buyer | Sale Price | Title Company |
|---|---|---|---|
| Rh Partners Ownerco 2 Llc | $11,459,037 | -- | |
| Rh Partners Ownerco Llc | -- | -- | |
| Sfr Assets Owner Llc | $143,598 | -- | |
| Firebird Sfe I Llc | $106,000 | -- | |
| Suttles James | $52,500 | -- | |
| National Cty Bk | $56,250 | -- | |
| Greene Marshall Derrick | $85,900 | -- |
Source: Public Records
Mortgage History
| Date | Status | Borrower | Loan Amount |
|---|---|---|---|
| Previous Owner | Suttles James | $51,548 | |
| Closed | Greene Marshall Derrick | $0 |
Source: Public Records
Tax History
| Year | Tax Paid | Tax Assessment Tax Assessment Total Assessment is a certain percentage of the fair market value that is determined by local assessors to be the total taxable value of land and additions on the property. | Land | Improvement |
|---|---|---|---|---|
| 2025 | $2,469 | $99,240 | $6,878 | $92,362 |
| 2024 | $1,671 | $65,960 | $6,640 | $59,320 |
| 2023 | $1,790 | $65,960 | $6,640 | $59,320 |
| 2022 | $1,790 | $65,960 | $6,640 | $59,320 |
| 2021 | $1,599 | $52,720 | $6,640 | $46,080 |
| 2020 | $1,486 | $44,240 | $7,200 | $37,040 |
| 2019 | $1,460 | $42,800 | $7,200 | $35,600 |
| 2018 | $710 | $41,360 | $7,200 | $34,160 |
| 2017 | $214 | $35,440 | $5,400 | $30,040 |
| 2016 | $100 | $32,120 | $5,400 | $26,720 |
| 2015 | $32 | $30,200 | $5,400 | $24,800 |
| 2014 | $31 | $30,200 | $0 | $0 |
Source: Public Records
Map
Nearby Homes
- 195 Cedar Rd
- 225 Oak Hill Dr
- 25 Castlehill Ct
- 70 Blackberry Ln
- 0 Roseberry Rd
- 10 Barberry Cir
- 585 Cowan Rd
- 35 Knights Cir
- 60 Knights Cir
- 0 Tempie Ln
- 205 Woodcrest Dr
- 40 Belmont Cir Unit 2
- 55 Twin Lakes Dr
- 60 Katelen Ct
- 0 Eleanor Dr Unit 10443925
- 195 Twin Lakes Dr
- 75 Cannonade Ct
- 300 Brickstone Pkwy
- 25 Woodcrest Dr
- 1295 Mills Cove Dr
- 50 Cedar Rd
- 50 Cedar Rd
- 40 Cedar Rd
- 38 Oak Hill Rd
- 68 Cedar Rd
- 0 Cedar Rd Unit 3038400
- 0 Cedar Rd Unit CM307635
- 0 Cedar Rd Unit CM354588
- 0 Cedar Rd Unit CM318606
- 0 Cedar Rd Unit 7320614
- 0 Cedar Rd Unit 10222553
- 0 Cedar Rd Unit 1012039
- 0 Cedar Rd Unit 7300227
- 3043 Highway 81 S
- 45 Oak Hill Rd
- 0 Hwy 81 S Unit 3170781
- 0 Hwy 81 S Unit CM933809
- 0 Hwy 81 S Unit 6525454
- 51 Cedar Rd
- 3063 Highway 81 S
Your Personal Tour Guide
Ask me questions while you tour the home.