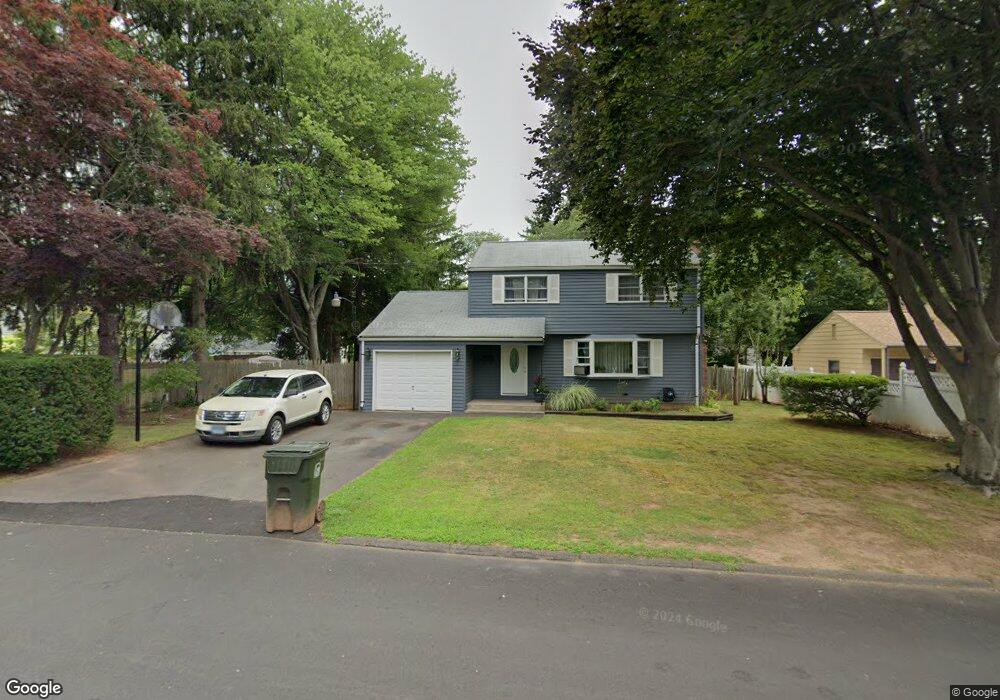
50 Coburn Ave Newington, CT 06111
Estimated Value: $342,000 - $379,000
3
Beds
2
Baths
1,482
Sq Ft
$243/Sq Ft
Est. Value
About This Home
This home is located at 50 Coburn Ave, Newington, CT 06111 and is currently estimated at $359,813, approximately $242 per square foot. 50 Coburn Ave is a home located in Hartford County with nearby schools including Anna Reynolds School, Martin Kellogg Middle School, and Newington High School.
Ownership History
Date
Name
Owned For
Owner Type
Purchase Details
Closed on
Feb 2, 2018
Sold by
Riccardi Michelle Y
Bought by
Riccardi Michael E
Current Estimated Value
Purchase Details
Closed on
Jan 19, 1999
Sold by
Swanson Hailin E
Bought by
Riccardi Michael E and Riccardi Michelle Y
Home Financials for this Owner
Home Financials are based on the most recent Mortgage that was taken out on this home.
Original Mortgage
$130,900
Interest Rate
6.7%
Create a Home Valuation Report for This Property
The Home Valuation Report is an in-depth analysis detailing your home's value as well as a comparison with similar homes in the area
Home Values in the Area
Average Home Value in this Area
Purchase History
| Date | Buyer | Sale Price | Title Company |
|---|---|---|---|
| Riccardi Michael E | -- | -- | |
| Riccardi Michael E | $132,500 | -- |
Source: Public Records
Mortgage History
| Date | Status | Borrower | Loan Amount |
|---|---|---|---|
| Previous Owner | Riccardi Michael E | $5,500 | |
| Previous Owner | Riccardi Michael E | $130,900 | |
| Previous Owner | Riccardi Michael E | $56,200 |
Source: Public Records
Tax History Compared to Growth
Tax History
| Year | Tax Paid | Tax Assessment Tax Assessment Total Assessment is a certain percentage of the fair market value that is determined by local assessors to be the total taxable value of land and additions on the property. | Land | Improvement |
|---|---|---|---|---|
| 2025 | $5,831 | $145,840 | $53,470 | $92,370 |
| 2024 | $5,785 | $145,840 | $53,470 | $92,370 |
| 2023 | $5,594 | $145,840 | $53,470 | $92,370 |
| 2022 | $5,613 | $145,840 | $53,470 | $92,370 |
| 2021 | $5,660 | $145,840 | $53,470 | $92,370 |
| 2020 | $5,668 | $144,310 | $53,470 | $90,840 |
| 2019 | $5,693 | $144,310 | $53,470 | $90,840 |
| 2018 | $5,556 | $144,310 | $53,470 | $90,840 |
| 2017 | $5,280 | $144,310 | $53,470 | $90,840 |
| 2016 | $5,159 | $144,310 | $53,470 | $90,840 |
| 2014 | $4,853 | $139,580 | $54,100 | $85,480 |
Source: Public Records
Map
Nearby Homes
- 66 1st St
- 1243 East St Unit F
- 1251 East St Unit F
- 21 7th St
- 1259 East St Unit A
- 70 Connecticut Ave
- 34 Beacon St
- 79 Lantern Hill
- 37 Recano Rd
- 835 East St Unit 837
- 18 Old Musket Dr
- 1403 Stanley St
- 227 Amherst St
- 212 Maple Hill Ave
- 13 Standard St
- 59 Smalley St
- 11 Eleanor Place
- 151 Smalley St
- 426 Allen St
- 233 Jubilee St