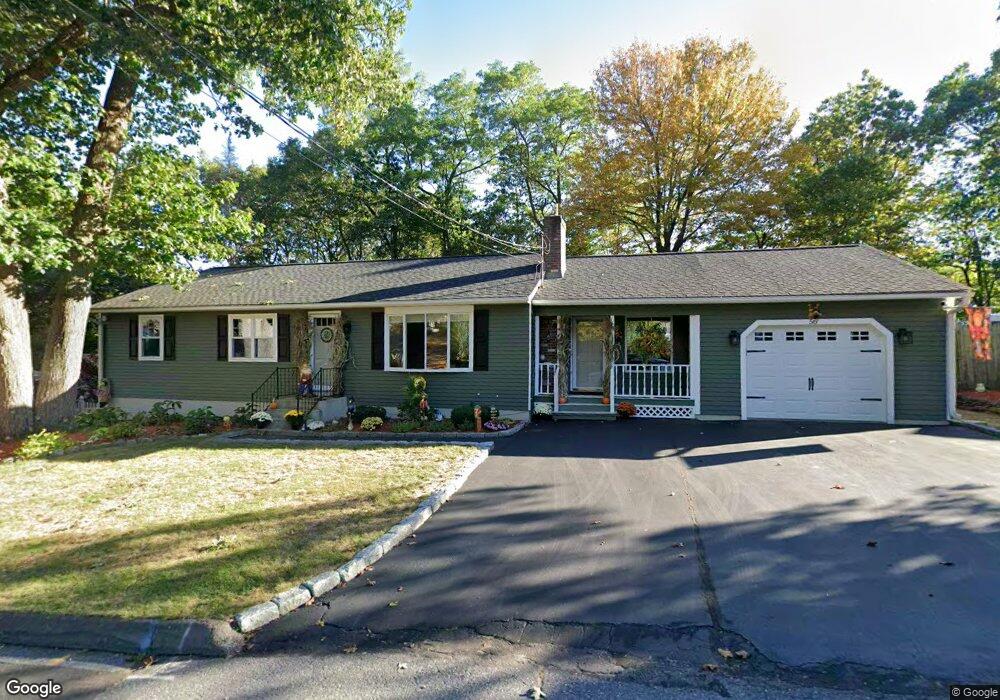
50 Colony Rd Fitchburg, MA 01420
West Fitchburg NeighborhoodEstimated Value: $415,000 - $439,000
3
Beds
1
Bath
1,554
Sq Ft
$274/Sq Ft
Est. Value
About This Home
This home is located at 50 Colony Rd, Fitchburg, MA 01420 and is currently estimated at $426,292, approximately $274 per square foot. 50 Colony Rd is a home located in Worcester County with nearby schools including Reingold Elementary School, South Street Elementary School, and Crocker Elementary School.
Ownership History
Date
Name
Owned For
Owner Type
Purchase Details
Closed on
Jun 16, 2021
Sold by
Gallo Frank J and Gallo Sharon M
Bought by
Sharon M Gallo Ret and Gallo
Current Estimated Value
Purchase Details
Closed on
Jul 19, 1978
Bought by
Gallo Frank J and Gallo Sharon M
Create a Home Valuation Report for This Property
The Home Valuation Report is an in-depth analysis detailing your home's value as well as a comparison with similar homes in the area
Home Values in the Area
Average Home Value in this Area
Purchase History
| Date | Buyer | Sale Price | Title Company |
|---|---|---|---|
| Sharon M Gallo Ret | -- | None Available | |
| Gallo Frank J | $37,000 | -- |
Source: Public Records
Mortgage History
| Date | Status | Borrower | Loan Amount |
|---|---|---|---|
| Previous Owner | Gallo Frank J | $100,000 | |
| Previous Owner | Gallo Frank J | $45,000 | |
| Previous Owner | Gallo Frank J | $65,000 | |
| Previous Owner | Gallo Frank J | $40,000 |
Source: Public Records
Tax History Compared to Growth
Tax History
| Year | Tax Paid | Tax Assessment Tax Assessment Total Assessment is a certain percentage of the fair market value that is determined by local assessors to be the total taxable value of land and additions on the property. | Land | Improvement |
|---|---|---|---|---|
| 2025 | $47 | $348,700 | $102,900 | $245,800 |
| 2024 | $4,637 | $313,100 | $75,000 | $238,100 |
| 2023 | $4,587 | $286,300 | $66,300 | $220,000 |
| 2022 | $4,339 | $246,400 | $63,800 | $182,600 |
| 2021 | $4,447 | $233,700 | $60,000 | $173,700 |
| 2020 | $4,295 | $217,900 | $55,000 | $162,900 |
| 2019 | $4,008 | $195,600 | $60,000 | $135,600 |
| 2018 | $3,750 | $178,500 | $55,000 | $123,500 |
| 2017 | $3,582 | $166,700 | $51,300 | $115,400 |
| 2016 | $3,384 | $159,400 | $48,800 | $110,600 |
| 2015 | $3,253 | $157,300 | $46,300 | $111,000 |
| 2014 | $3,093 | $156,000 | $45,000 | $111,000 |
Source: Public Records
Map
Nearby Homes
- 103 Brierwood Dr
- 70 Sanborn St
- 17 Simonds Rd
- 95 Loiselle Ave
- 87 Roosevelt St
- 45 Norwood St
- 14 Felton St
- 51-53 Wachusett St
- 87 Eaton St
- 592 Westminster Hill Rd
- 57 Leroy St
- 93 Overland St
- 65 Southwick St
- 465 Franklin Rd
- 35 Bernadette St
- 358-360 Fairmount St
- 0 Fairmount St
- 276 Fairmount St
- 34 Oak Leaf Rd
- 162 Delisle St