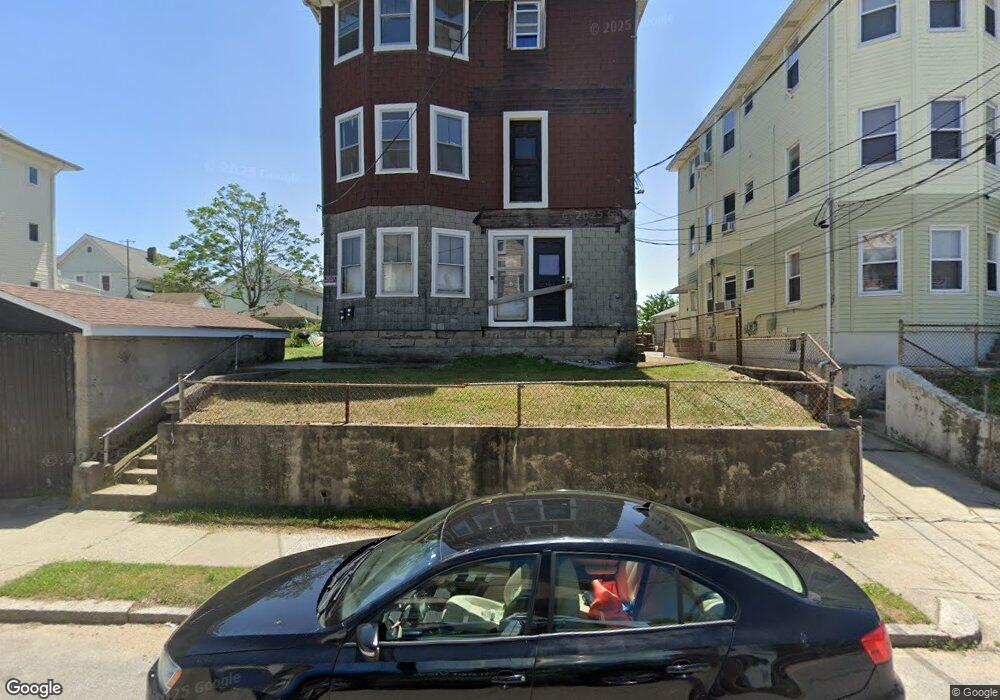
50 Cooper St Pawtucket, RI 02860
Fairlawn NeighborhoodEstimated Value: $575,000 - $725,000
9
Beds
3
Baths
3,210
Sq Ft
$203/Sq Ft
Est. Value
About This Home
This home is located at 50 Cooper St, Pawtucket, RI 02860 and is currently estimated at $652,000, approximately $203 per square foot. 50 Cooper St is a home located in Providence County with nearby schools including International Charter School, Blackstone Valley Prep Junior High School, and Blackstone Academy Charter School.
Ownership History
Date
Name
Owned For
Owner Type
Purchase Details
Closed on
Jun 17, 2024
Sold by
Pawtucket City Of
Bought by
Airway Leasing Llc
Current Estimated Value
Purchase Details
Closed on
Aug 27, 2021
Sold by
Smith Lance D
Bought by
Cruz Nelson and Cruz Elaine L
Purchase Details
Closed on
Apr 25, 1988
Bought by
Bowley Hope D and Smith Lance David
Create a Home Valuation Report for This Property
The Home Valuation Report is an in-depth analysis detailing your home's value as well as a comparison with similar homes in the area
Home Values in the Area
Average Home Value in this Area
Purchase History
| Date | Buyer | Sale Price | Title Company |
|---|---|---|---|
| Airway Leasing Llc | $2,258 | None Available | |
| Airway Leasing Llc | $2,258 | None Available | |
| Cruz Nelson | -- | None Available | |
| Cruz Nelson | -- | None Available | |
| Bowley Hope D | -- | -- |
Source: Public Records
Tax History Compared to Growth
Tax History
| Year | Tax Paid | Tax Assessment Tax Assessment Total Assessment is a certain percentage of the fair market value that is determined by local assessors to be the total taxable value of land and additions on the property. | Land | Improvement |
|---|---|---|---|---|
| 2024 | $5,456 | $442,100 | $116,800 | $325,300 |
| 2023 | $4,791 | $282,800 | $52,600 | $230,200 |
| 2022 | $4,689 | $282,800 | $52,600 | $230,200 |
| 2021 | $4,689 | $282,800 | $52,600 | $230,200 |
| 2020 | $3,938 | $188,500 | $53,200 | $135,300 |
| 2019 | $3,938 | $188,500 | $53,200 | $135,300 |
| 2018 | $3,795 | $188,500 | $53,200 | $135,300 |
| 2017 | $3,603 | $158,600 | $40,000 | $118,600 |
| 2016 | $3,472 | $158,600 | $40,000 | $118,600 |
| 2015 | $3,472 | $158,600 | $40,000 | $118,600 |
| 2014 | $2,979 | $129,200 | $51,500 | $77,700 |
Source: Public Records
Map
Nearby Homes