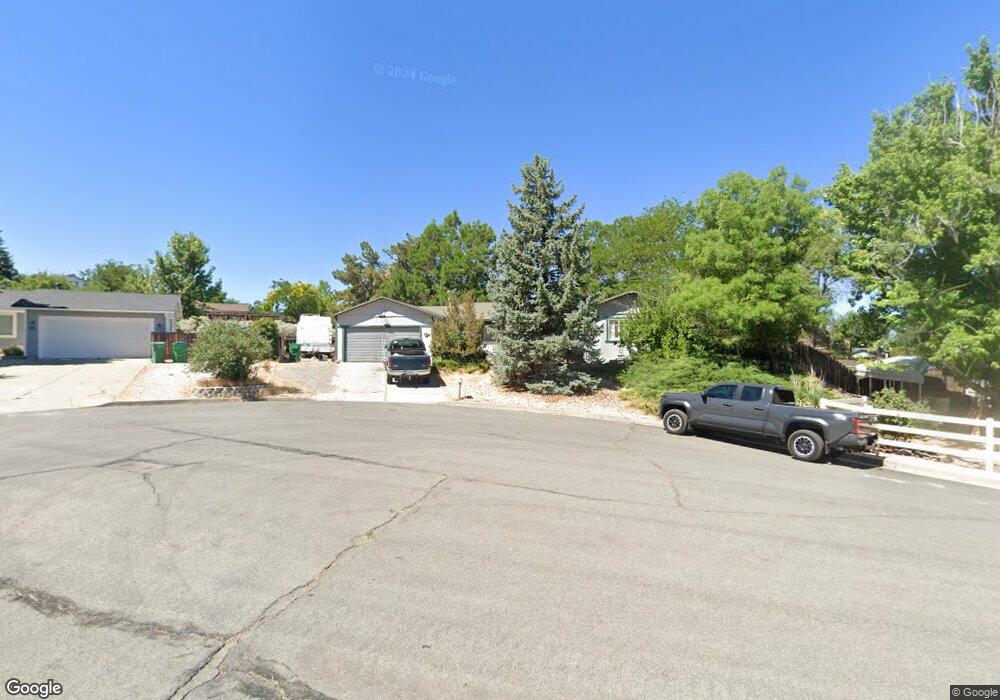
50 Count Fleet Ct Unit 1 Reno, NV 89502
Hidden Valley NeighborhoodEstimated Value: $572,000 - $601,000
4
Beds
2
Baths
1,609
Sq Ft
$368/Sq Ft
Est. Value
About This Home
This home is located at 50 Count Fleet Ct Unit 1, Reno, NV 89502 and is currently estimated at $591,659, approximately $367 per square foot. 50 Count Fleet Ct Unit 1 is a home located in Washoe County with nearby schools including Hidden Valley Elementary School, Edward L Pine Middle School, and Earl Wooster High School.
Ownership History
Date
Name
Owned For
Owner Type
Purchase Details
Closed on
Jan 14, 2004
Sold by
Chadwick Mark D
Bought by
Chadwick Mark D
Current Estimated Value
Home Financials for this Owner
Home Financials are based on the most recent Mortgage that was taken out on this home.
Original Mortgage
$185,000
Outstanding Balance
$77,479
Interest Rate
4.62%
Mortgage Type
New Conventional
Estimated Equity
$514,180
Purchase Details
Closed on
Dec 20, 2002
Sold by
Chadwick Michelle S
Bought by
Chadwick Mark D
Home Financials for this Owner
Home Financials are based on the most recent Mortgage that was taken out on this home.
Original Mortgage
$170,400
Interest Rate
5.86%
Purchase Details
Closed on
Jan 26, 2001
Sold by
Pferschy Daniel W and Pferschy Nanci J
Bought by
Chadwick Mark D and Chadwick Michelle S
Home Financials for this Owner
Home Financials are based on the most recent Mortgage that was taken out on this home.
Original Mortgage
$156,640
Interest Rate
7.41%
Create a Home Valuation Report for This Property
The Home Valuation Report is an in-depth analysis detailing your home's value as well as a comparison with similar homes in the area
Home Values in the Area
Average Home Value in this Area
Purchase History
| Date | Buyer | Sale Price | Title Company |
|---|---|---|---|
| Chadwick Mark D | -- | First American Title | |
| Chadwick Mark D | $170,400 | First American Title | |
| Chadwick Mark D | $178,000 | Founders Title Co |
Source: Public Records
Mortgage History
| Date | Status | Borrower | Loan Amount |
|---|---|---|---|
| Open | Chadwick Mark D | $185,000 | |
| Closed | Chadwick Mark D | $170,400 | |
| Closed | Chadwick Mark D | $156,640 |
Source: Public Records
Tax History
| Year | Tax Paid | Tax Assessment Tax Assessment Total Assessment is a certain percentage of the fair market value that is determined by local assessors to be the total taxable value of land and additions on the property. | Land | Improvement |
|---|---|---|---|---|
| 2026 | $1,396 | $91,871 | $61,250 | $30,621 |
| 2024 | $1,813 | $85,842 | $52,605 | $33,237 |
| 2023 | $1,760 | $84,779 | $52,605 | $32,174 |
| 2022 | $1,709 | $68,706 | $41,300 | $27,406 |
| 2021 | $1,660 | $59,615 | $31,745 | $27,870 |
| 2020 | $1,613 | $60,310 | $31,745 | $28,565 |
| 2019 | $1,563 | $57,496 | $29,330 | $28,166 |
| 2018 | $1,518 | $50,196 | $22,085 | $28,111 |
| 2017 | $1,475 | $49,410 | $21,105 | $28,305 |
| 2016 | $1,437 | $50,153 | $20,860 | $29,293 |
| 2015 | $1,435 | $47,173 | $17,605 | $29,568 |
| 2014 | $1,393 | $42,829 | $13,930 | $28,899 |
| 2013 | -- | $42,764 | $13,930 | $28,834 |
Source: Public Records
Map
Nearby Homes
- 1860 Hidden Meadows Dr
- 2835 Parkway Dr
- 3325 E Hidden Valley Dr
- 3370 Shawnee Cir
- 6815 Prestwick Cir
- 3620 E Hidden Valley Dr
- 3501 E Hidden Valley Dr
- 5585 E Hidden Valley Dr
- 5705 Blue Hills Dr
- 2790 Fairwood Dr
- 4841 W Hidden Valley Dr
- 5279 Mira Loma Dr
- 5860 E Hidden Valley Dr
- 3059 Creekwood Dr
- 3108 Joshua Park Dr
- 3225 Eaglewood Dr Unit 1
- 4572 Sage Rose Way
- 3504 Heron's Cir
- 4559 China Rose Cir
- 2945 Santa Ana Dr
- 2110 Whirlaway Place
- 30 Count Fleet Ct
- 2090 Parkway Dr
- 60 Count Fleet Ct
- 2120 Whirlaway Place Unit 1
- 2080 Parkway Dr
- 75 Count Fleet Ct
- 55 Count Fleet Ct Unit 1
- 65 Count Fleet Ct
- 2130 Whirlaway Place
- 45 Count Fleet Ct
- 2140 Parkway Dr
- 7267 Bold Venture Ct
- 2115 Parkway Dr
- 2105 Parkway Dr
- 2125 Parkway Dr
- 15 Count Fleet Ct Unit 1
- 2095 Parkway Dr
- 7269 Bold Venture Ct
- 25 Count Fleet Ct Unit 1
Your Personal Tour Guide
Ask me questions while you tour the home.