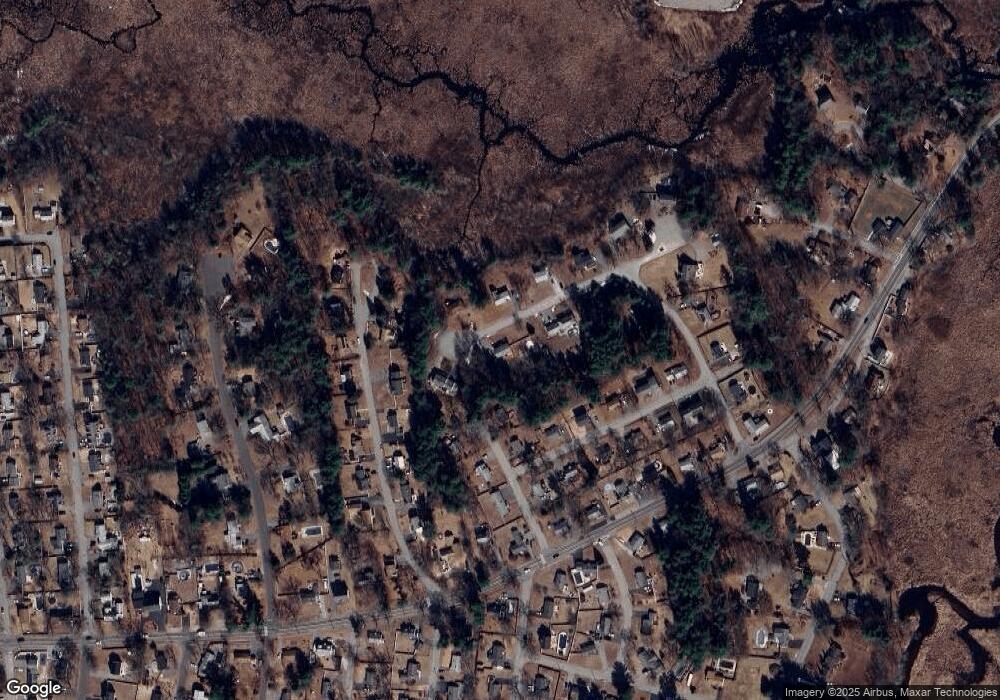
50 Cynthia Rd Tewksbury, MA 01876
Estimated Value: $560,000 - $753,000
3
Beds
2
Baths
1,118
Sq Ft
$577/Sq Ft
Est. Value
About This Home
This home is located at 50 Cynthia Rd, Tewksbury, MA 01876 and is currently estimated at $644,951, approximately $576 per square foot. 50 Cynthia Rd is a home located in Middlesex County with nearby schools including Heath-Brook Elementary School, John W. Wynn Middle School, and John F. Ryan Elementary School.
Ownership History
Date
Name
Owned For
Owner Type
Purchase Details
Closed on
Aug 5, 2020
Sold by
Barbara Oconnell Ret
Bought by
Lawless Ret 2005
Current Estimated Value
Purchase Details
Closed on
Jun 26, 2007
Sold by
Lawless Barbara and Lawless John F
Bought by
Lawless Tr Barbara and Lawless John F
Purchase Details
Closed on
Nov 2, 2004
Sold by
Lawless Jeanette
Bought by
Lawless John F and Oconnell Barbara
Purchase Details
Closed on
Jun 27, 1979
Bought by
Lawless J F and Lawless Barbara
Create a Home Valuation Report for This Property
The Home Valuation Report is an in-depth analysis detailing your home's value as well as a comparison with similar homes in the area
Home Values in the Area
Average Home Value in this Area
Purchase History
| Date | Buyer | Sale Price | Title Company |
|---|---|---|---|
| Lawless Ret 2005 | -- | None Available | |
| Lawless Tr Barbara | -- | -- | |
| Lawless John F | -- | -- | |
| Lawless J F | $42,900 | -- |
Source: Public Records
Mortgage History
| Date | Status | Borrower | Loan Amount |
|---|---|---|---|
| Previous Owner | Lawless J F | $100,000 |
Source: Public Records
Tax History Compared to Growth
Tax History
| Year | Tax Paid | Tax Assessment Tax Assessment Total Assessment is a certain percentage of the fair market value that is determined by local assessors to be the total taxable value of land and additions on the property. | Land | Improvement |
|---|---|---|---|---|
| 2025 | $7,628 | $577,000 | $320,600 | $256,400 |
| 2024 | $7,318 | $546,500 | $305,400 | $241,100 |
| 2023 | $7,094 | $503,100 | $277,500 | $225,600 |
| 2022 | $6,737 | $443,200 | $241,300 | $201,900 |
| 2021 | $6,417 | $408,200 | $219,500 | $188,700 |
| 2020 | $6,292 | $394,000 | $209,100 | $184,900 |
| 2019 | $5,691 | $359,300 | $199,100 | $160,200 |
| 2018 | $5,505 | $341,300 | $199,100 | $142,200 |
| 2017 | $5,141 | $315,200 | $189,500 | $125,700 |
| 2016 | $4,993 | $305,400 | $189,500 | $115,900 |
| 2015 | $4,900 | $299,300 | $183,800 | $115,500 |
| 2014 | $4,653 | $288,800 | $183,800 | $105,000 |
Source: Public Records
Map
Nearby Homes