50 Davenport St Chicopee, MA 01013
Chicopee Center NeighborhoodEstimated Value: $277,000 - $343,396
4
Beds
2
Baths
1,950
Sq Ft
$166/Sq Ft
Est. Value
About This Home
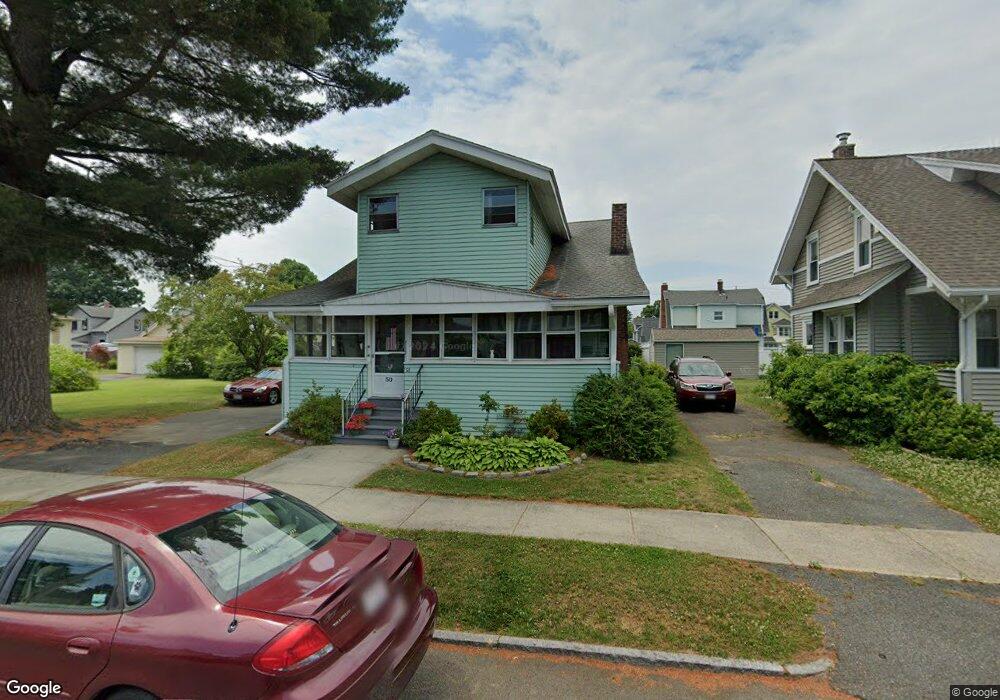
This home is located at 50 Davenport St, Chicopee, MA 01013 and is currently estimated at $324,599, approximately $166 per square foot. 50 Davenport St is a home located in Hampden County with nearby schools including Bowe Elementary School, Fairview Middle School, and Chicopee High School.
Ownership History
Date
Name
Owned For
Owner Type
Purchase Details
Closed on
Dec 26, 2019
Sold by
Deane Sandra L
Bought by
Deane Ellen L and Deane John E
Current Estimated Value
Purchase Details
Closed on
Nov 4, 2019
Sold by
Deane Thomas P Est
Bought by
Deane Sandra L
Purchase Details
Closed on
Feb 22, 2011
Sold by
Deane Ellen L and Deane Thomas P
Bought by
Deane Ellen L and Deane Thomas P
Purchase Details
Closed on
Mar 7, 1983
Bought by
Deane Ellen L and Deane Thomas P
Create a Home Valuation Report for This Property
The Home Valuation Report is an in-depth analysis detailing your home's value as well as a comparison with similar homes in the area
Home Values in the Area
Average Home Value in this Area
Purchase History
| Date | Buyer | Sale Price | Title Company |
|---|---|---|---|
| Deane Ellen L | -- | None Available | |
| Deane Sandra L | -- | -- | |
| Deane Ellen L | -- | -- | |
| Deane Ellen L | -- | -- |
Source: Public Records
Tax History Compared to Growth
Tax History
| Year | Tax Paid | Tax Assessment Tax Assessment Total Assessment is a certain percentage of the fair market value that is determined by local assessors to be the total taxable value of land and additions on the property. | Land | Improvement |
|---|---|---|---|---|
| 2025 | $4,416 | $291,300 | $100,700 | $190,600 |
| 2024 | $4,186 | $283,600 | $98,700 | $184,900 |
| 2023 | $3,925 | $259,100 | $89,700 | $169,400 |
| 2022 | $3,748 | $220,600 | $78,000 | $142,600 |
| 2021 | $3,536 | $200,800 | $70,900 | $129,900 |
| 2020 | $3,358 | $192,300 | $70,900 | $121,400 |
| 2019 | $3,301 | $183,800 | $70,900 | $112,900 |
| 2018 | $3,201 | $174,800 | $67,500 | $107,300 |
| 2017 | $3,066 | $177,100 | $67,500 | $109,600 |
| 2016 | $3,111 | $184,000 | $67,500 | $116,500 |
| 2015 | $3,194 | $182,100 | $67,500 | $114,600 |
| 2014 | $1,597 | $182,100 | $67,500 | $114,600 |
Source: Public Records
Map
Nearby Homes
- 53 Davenport St
- 95 Weaver Rd
- 29 Fairfield Ave
- 20 Gilbert Ave
- 41 Nevada St
- 14-16 Gold St
- Lot 1 Marion St
- 2 Marion St
- 248 Hampden St
- 255 Moore St
- 115 Caseland St
- 30 Beauchamp St
- 110 Roosevelt Ave
- 163 Saratoga Ave
- 168 Hampden St
- 57- 59 Stearns Terrace
- 126 Casino Ave
- 74 David St
- 28 Hartley St
- 596-598 Newbury St
- 38 Davenport St
- 36 Davenport St
- 54 Davenport St
- 43 Davenport St
- 29 Northwood St
- 23 Northwood St
- 35 Northwood St
- 35 Davenport St
- 30 Davenport St
- 57 Davenport St
- 62 Davenport St
- 17 Northwood St
- 37 Northwood St
- 31 Davenport St
- 63 Davenport St
- 26 Davenport St
- 43 Northwood St
- 64 Davenport St
- 68 Rimmon Ave
- 13 Northwood St