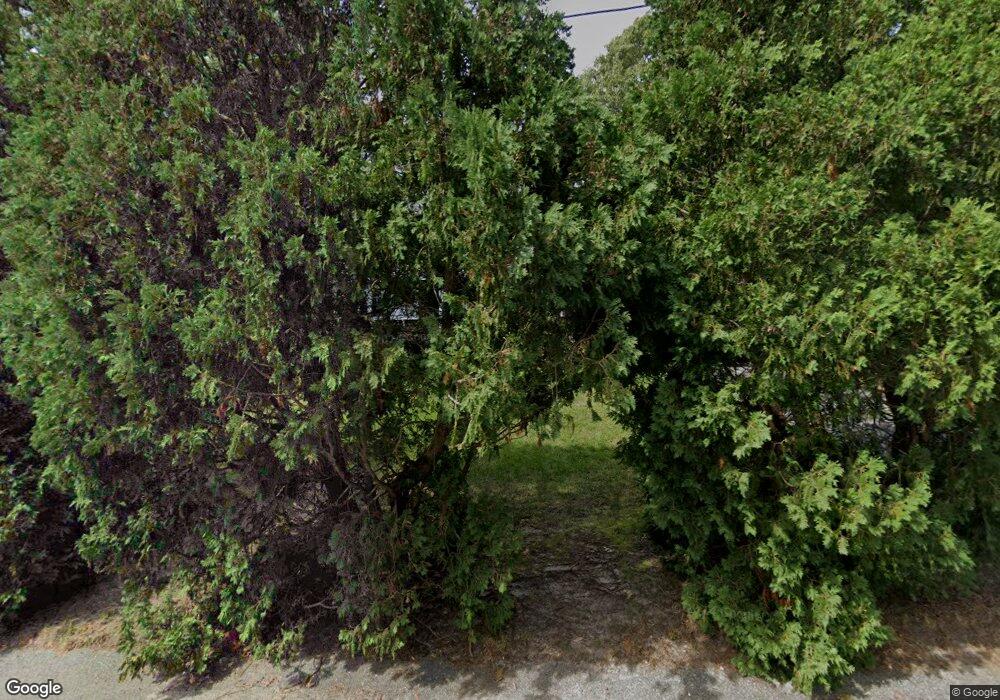
50 Debbie Ln South Dennis, MA 02660
South Dennis NeighborhoodEstimated Value: $645,620 - $754,000
About This Home
YEARLY RENTAL:
TOWNHOUSE STYLE DUPLEX.
Centrally located in South Dennis.
Public beaches on both Bay and Ocean only
a short drive away.
Amenitites include:
THREE Bedrooms on the Second Floor
ONE and ONE HALF Bathrooms
1053 sf Living space
Full eat-in kitchen Deck off Kitchen
Gas Hot Air Heat
Unfinished Basement for storage
Washer/dryer hook-up in basement
Unfinished basement
Landscaping included
REQUIRED: Completed pre-screening questionnaire
GOOD current credit score for all adult tenants.
Past/Present references Verifiable proof of income First/Last/Security= $7,800
Ownership History
Purchase Details
Purchase Details
Home Values in the Area
Average Home Value in this Area
Purchase History
| Date | Buyer | Sale Price | Title Company |
|---|---|---|---|
| Ingram Judith W | -- | None Available | |
| Ingram Samuel P | -- | -- |
Mortgage History
| Date | Status | Borrower | Loan Amount |
|---|---|---|---|
| Previous Owner | Ingram Samuel P | $194,500 |
Property History
| Date | Event | Price | List to Sale | Price per Sq Ft |
|---|---|---|---|---|
| 11/01/2024 11/01/24 | Off Market | $2,600 | -- | -- |
| 10/08/2024 10/08/24 | Off Market | $2,700 | -- | -- |
| 10/07/2024 10/07/24 | Price Changed | $2,600 | -3.7% | $2 / Sq Ft |
| 10/06/2024 10/06/24 | For Rent | $2,700 | -5.3% | -- |
| 10/01/2024 10/01/24 | For Rent | $2,850 | +5.6% | -- |
| 09/26/2024 09/26/24 | Price Changed | $2,700 | -- | $3 / Sq Ft |
Tax History Compared to Growth
Tax History
| Year | Tax Paid | Tax Assessment Tax Assessment Total Assessment is a certain percentage of the fair market value that is determined by local assessors to be the total taxable value of land and additions on the property. | Land | Improvement |
|---|---|---|---|---|
| 2025 | $2,222 | $513,200 | $130,000 | $383,200 |
| 2024 | $2,069 | $471,400 | $125,000 | $346,400 |
| 2023 | $2,001 | $428,500 | $113,600 | $314,900 |
| 2022 | $1,973 | $352,400 | $113,800 | $238,600 |
| 2021 | $2,182 | $361,800 | $111,500 | $250,300 |
| 2020 | $2,123 | $348,100 | $111,500 | $236,600 |
| 2019 | $1,952 | $316,400 | $109,300 | $207,100 |
| 2018 | $1,626 | $256,500 | $93,700 | $162,800 |
| 2017 | $1,534 | $249,500 | $93,700 | $155,800 |
| 2016 | $1,491 | $228,400 | $104,100 | $124,300 |
| 2015 | $1,462 | $228,400 | $104,100 | $124,300 |
| 2014 | $1,450 | $228,400 | $104,100 | $124,300 |
Map
- 241 Old Bass River Rd
- 25 Skerry Rd
- 1 Norseman Dr
- 10 Joanne Dr
- 17 Margate Ln
- 7 Vinland Dr
- 40 Viking Dr
- 2 Hemlock Ln
- 6 Hawthorn St
- 62 Old Fish House Rd
- 52 Uncle Bobs Way
- 17 Fairmount Rd
- 17 Fairmount Rd
- 20 Sycamore Ln
- 153 Bayridge Dr
- 432 Old Chatham Rd Unit 403
- 432 Old Chatham Rd Unit 103
- 0 Ash Ct
- 310 Old Chatham Rd Unit D-30
- 310 Old Chatham Rd Unit A7
