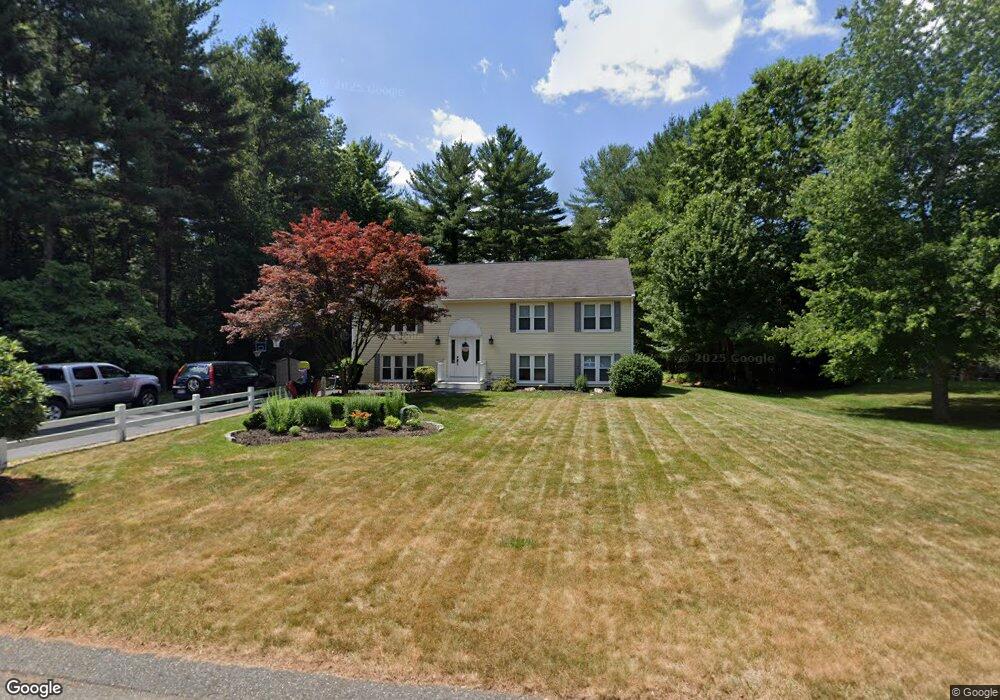
50 Deer Run Dr East Bridgewater, MA 02333
Estimated Value: $559,000 - $639,000
4
Beds
2
Baths
1,196
Sq Ft
$513/Sq Ft
Est. Value
About This Home
This home is located at 50 Deer Run Dr, East Bridgewater, MA 02333 and is currently estimated at $613,957, approximately $513 per square foot. 50 Deer Run Dr is a home located in Plymouth County with nearby schools including Central Elementary School, Gordon W Mitchell Middle School, and East Bridgewater Jr./Sr. High School.
Ownership History
Date
Name
Owned For
Owner Type
Purchase Details
Closed on
Dec 13, 2021
Sold by
Robles Joseph P
Bought by
Robles Joseph P and Robles Joseph M
Current Estimated Value
Purchase Details
Closed on
Oct 26, 1993
Sold by
Crescent Rdge Dev Corp
Bought by
Robles Joseph P and Robles Karen M
Create a Home Valuation Report for This Property
The Home Valuation Report is an in-depth analysis detailing your home's value as well as a comparison with similar homes in the area
Home Values in the Area
Average Home Value in this Area
Purchase History
| Date | Buyer | Sale Price | Title Company |
|---|---|---|---|
| Robles Joseph P | -- | None Available | |
| Robles Joseph P | $175,050 | -- |
Source: Public Records
Mortgage History
| Date | Status | Borrower | Loan Amount |
|---|---|---|---|
| Previous Owner | Robles Joseph P | $226,000 | |
| Previous Owner | Robles Joseph P | $250,000 |
Source: Public Records
Tax History Compared to Growth
Tax History
| Year | Tax Paid | Tax Assessment Tax Assessment Total Assessment is a certain percentage of the fair market value that is determined by local assessors to be the total taxable value of land and additions on the property. | Land | Improvement |
|---|---|---|---|---|
| 2025 | $7,618 | $557,300 | $233,400 | $323,900 |
| 2024 | $7,319 | $528,800 | $224,500 | $304,300 |
| 2023 | $7,254 | $502,000 | $224,500 | $277,500 |
| 2022 | $6,610 | $423,700 | $187,200 | $236,500 |
| 2021 | $6,378 | $374,100 | $179,800 | $194,300 |
| 2020 | $6,261 | $362,100 | $172,900 | $189,200 |
| 2019 | $6,070 | $345,700 | $165,300 | $180,400 |
| 2018 | $5,995 | $333,800 | $165,300 | $168,500 |
| 2017 | $5,860 | $320,200 | $157,600 | $162,600 |
| 2016 | $5,699 | $313,800 | $157,600 | $156,200 |
| 2015 | $5,591 | $314,800 | $156,500 | $158,300 |
| 2014 | $5,331 | $306,900 | $153,200 | $153,700 |
Source: Public Records
Map
Nearby Homes
- 1247 Central St
- 170 Elm St
- 1993 Washington St
- 71 Stonegate Dr
- 51 Stonegate Dr
- 22 Hudson St
- 2045 Washington St
- 936 Central St
- 182 Crystal Water Dr Unit 182
- 5 Della Way
- 9 Daisy Ln
- 28 Brookbend Way E
- 844 Washington St
- 217 Crystal Water Dr
- 587 Bridge St
- 1 Simmons Place
- 29 Hayes Rd
- 94 Pond St
- 26 Meadowbrook Dr
- 78 Crystal Water Dr