50 Devon Rd Norwood, MA 02062
North Norwood NeighborhoodEstimated Value: $743,000 - $828,000
About This Home
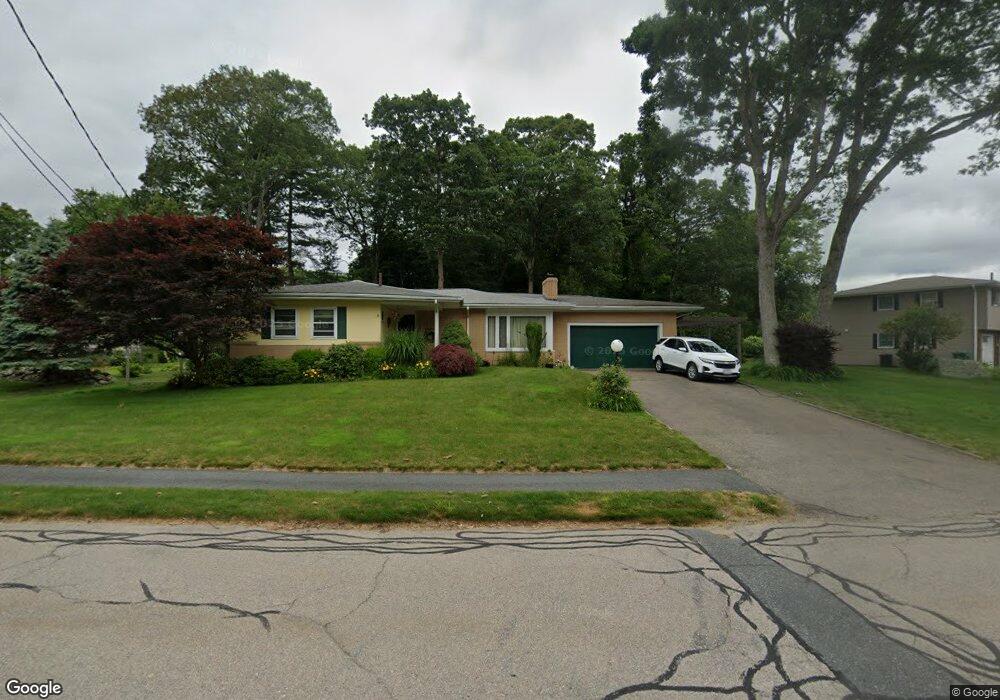
This home is located at 50 Devon Rd, Norwood, MA 02062 and is currently estimated at $783,385, approximately $585 per square foot. 50 Devon Rd is a home located in Norfolk County with nearby schools including Norwood High School, Norwood Montessori School, and St Catherine Of Siena School.
Ownership History
We collect this data history from publicly available records. To have your information removed, we recommend requesting removal directly through your county’s website.
Purchase Details
Purchase Details
Home Financials for this Owner
Home Financials are based on the most recent Mortgage that was taken out on this home.Home Values in the Area
Average Home Value in this Area
Purchase History
We collect this data history from publicly available records. To have your information removed, we recommend requesting removal directly through your county’s website.
| Date | Buyer | Sale Price | Title Company |
|---|---|---|---|
| -- | -- | ||
| $175,000 | -- |
Mortgage History
We collect this data history from publicly available records. To have your information removed, we recommend requesting removal directly through your county’s website.
| Date | Status | Borrower | Loan Amount |
|---|---|---|---|
| Previous Owner | $122,500 |
Tax History
We collect this data history from publicly available records. To have your information removed, we recommend requesting removal directly through your county’s website.
| Year | Tax Paid | Tax Assessment Tax Assessment Total Assessment is a certain percentage of the fair market value that is determined by local assessors to be the total taxable value of land and additions on the property. | Land | Improvement |
|---|---|---|---|---|
| 2025 | $70 | $667,700 | $340,200 | $327,500 |
| 2024 | $7,025 | $671,000 | $340,200 | $330,800 |
| 2023 | $6,235 | $604,200 | $281,000 | $323,200 |
| 2022 | $5,860 | $545,100 | $255,500 | $289,600 |
| 2021 | $5,368 | $473,400 | $246,200 | $227,200 |
| 2020 | $5,072 | $454,900 | $244,100 | $210,800 |
| 2019 | $4,918 | $451,600 | $236,600 | $215,000 |
| 2018 | $4,742 | $427,600 | $237,000 | $190,600 |
| 2017 | $4,606 | $413,100 | $237,000 | $176,100 |
| 2016 | $4,353 | $391,500 | $237,000 | $154,500 |
| 2015 | $4,292 | $374,200 | $215,500 | $158,700 |
| 2014 | $4,091 | $353,300 | $203,500 | $149,800 |
Map
- 29 Devon Rd
- 31 Harrow Rd
- 11 Malvern Rd
- 16 Buckingham Rd
- 28 Lancelot Ct
- 56 Yarmouth Rd
- 5 Albemarle Rd
- 29 Laurel Rd
- 521 Walpole St
- 269 Bullard St
- 7 Ivy Cir
- 535 Walpole St
- 70 Endicott St Unit 1505
- 204 Walpole St
- 7 Pettees Pond Ln
- 11 Pettees Pond Ln
- 11 Quincy Ave
- 35 Alandale Pkwy
- 26 Tremont St
- 428 Prospect St
Ask me questions while you tour the home.