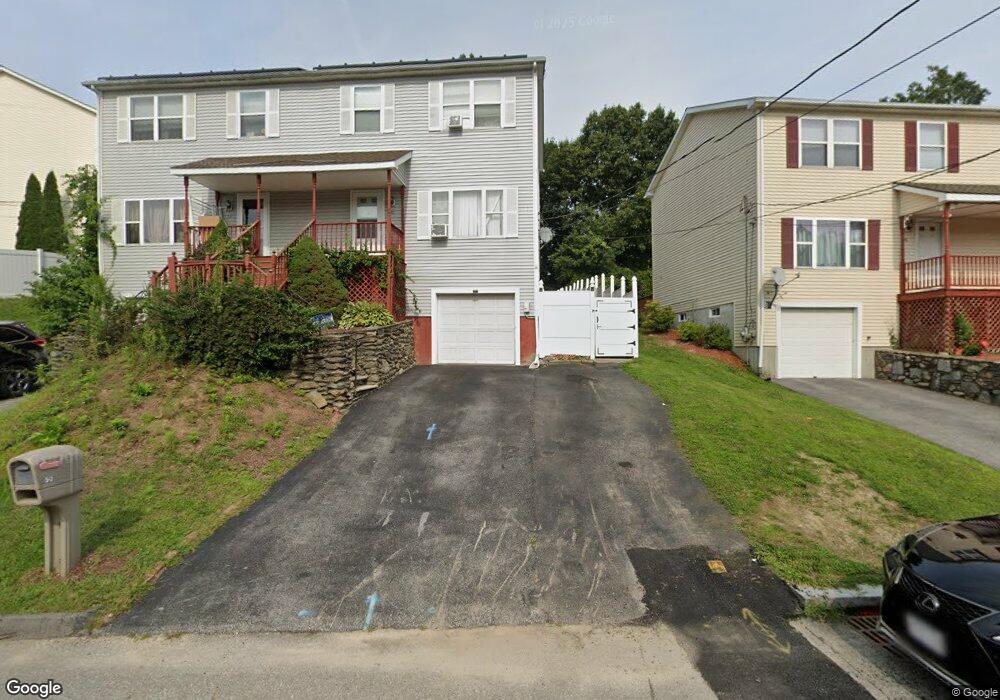
50 Dixfield St Worcester, MA 01606
Summit NeighborhoodEstimated Value: $437,000 - $453,000
3
Beds
3
Baths
1,256
Sq Ft
$356/Sq Ft
Est. Value
About This Home
This home is located at 50 Dixfield St, Worcester, MA 01606 and is currently estimated at $447,152, approximately $356 per square foot. 50 Dixfield St is a home located in Worcester County with nearby schools including Norrback Avenue Elementary School, Jacob Hiatt Magnet School, and Chandler Magnet.
Ownership History
Date
Name
Owned For
Owner Type
Purchase Details
Closed on
Oct 9, 2012
Sold by
Boateng Dorothy
Bought by
Boateng Jonas
Current Estimated Value
Purchase Details
Closed on
Sep 18, 2008
Sold by
Home Loan Svcs Inc
Bought by
Boateng Dorothy
Home Financials for this Owner
Home Financials are based on the most recent Mortgage that was taken out on this home.
Original Mortgage
$179,029
Interest Rate
6.54%
Mortgage Type
Purchase Money Mortgage
Purchase Details
Closed on
Mar 28, 2008
Sold by
Newell Duncan
Bought by
Deutsche Bk Natl T Co
Purchase Details
Closed on
Feb 18, 2005
Sold by
Arrowsic Llc
Bought by
Lewis Dionne Simone and Newell Duncan
Home Financials for this Owner
Home Financials are based on the most recent Mortgage that was taken out on this home.
Original Mortgage
$204,000
Interest Rate
5.78%
Mortgage Type
Purchase Money Mortgage
Create a Home Valuation Report for This Property
The Home Valuation Report is an in-depth analysis detailing your home's value as well as a comparison with similar homes in the area
Home Values in the Area
Average Home Value in this Area
Purchase History
| Date | Buyer | Sale Price | Title Company |
|---|---|---|---|
| Boateng Jonas | -- | -- | |
| Boateng Dorothy | $180,000 | -- | |
| Deutsche Bk Natl T Co | $154,900 | -- | |
| Lewis Dionne Simone | $255,000 | -- |
Source: Public Records
Mortgage History
| Date | Status | Borrower | Loan Amount |
|---|---|---|---|
| Previous Owner | Boateng Dorothy | $179,029 | |
| Previous Owner | Lewis Dionne Simone | $204,000 |
Source: Public Records
Tax History Compared to Growth
Tax History
| Year | Tax Paid | Tax Assessment Tax Assessment Total Assessment is a certain percentage of the fair market value that is determined by local assessors to be the total taxable value of land and additions on the property. | Land | Improvement |
|---|---|---|---|---|
| 2025 | $5,062 | $383,800 | $102,800 | $281,000 |
| 2024 | $4,822 | $350,700 | $102,800 | $247,900 |
| 2023 | $4,615 | $321,800 | $89,400 | $232,400 |
| 2022 | $4,227 | $277,900 | $71,500 | $206,400 |
| 2021 | $4,081 | $250,700 | $57,200 | $193,500 |
| 2020 | $4,027 | $236,900 | $57,200 | $179,700 |
| 2019 | $3,877 | $215,400 | $51,500 | $163,900 |
| 2018 | $3,886 | $205,500 | $51,500 | $154,000 |
| 2017 | $3,690 | $192,000 | $51,500 | $140,500 |
| 2016 | $3,631 | $176,200 | $38,600 | $137,600 |
| 2015 | $3,536 | $176,200 | $38,600 | $137,600 |
| 2014 | $3,443 | $176,200 | $38,600 | $137,600 |
Source: Public Records
Map
Nearby Homes
- 44 Dixfield St
- 22 Danielles Way
- 26 Danielles Way
- 31 Danielles Way
- 29 Isleboro St
- 39 Meola Ave
- 33 Isleboro St
- 33 Meola Ave
- 9 Idalla Ave
- 1097 W Boylston St
- 1110 W Boylston St Unit A
- 12 Dixfield Rd
- 12 Birchbrush Ln
- 740 Burncoat St Unit B
- 602 Burncoat St
- 3 Malden St
- 93 Winfield Rd
- 1 Highland Ave
- 29 Glenwood St
- 83 Stoneleigh Rd