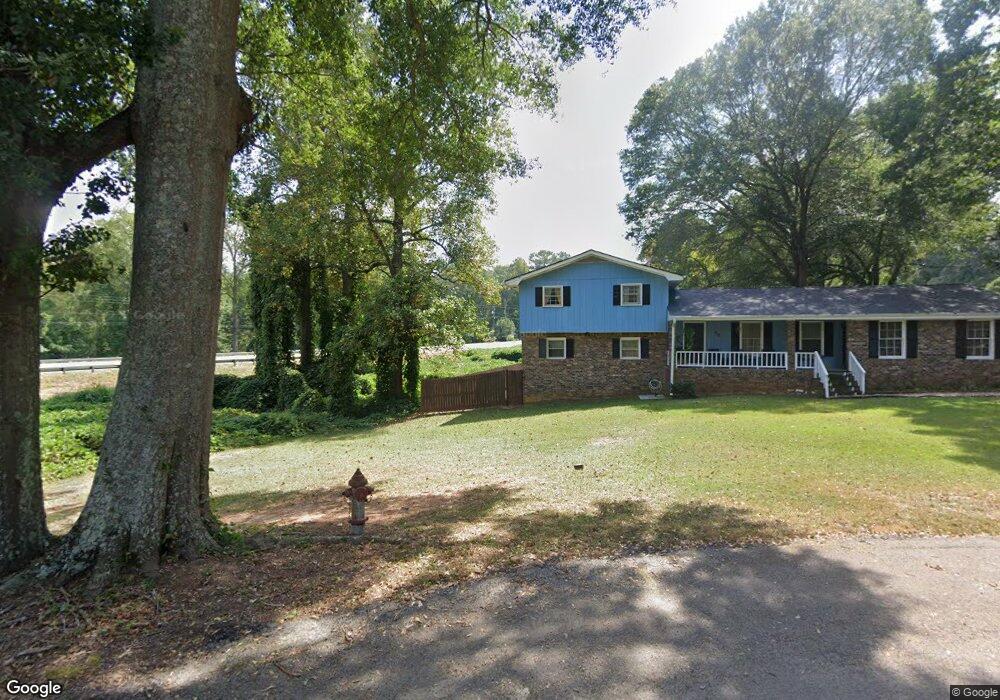
50 Don Rich Dr Carrollton, GA 30117
Estimated Value: $233,000 - $265,000
4
Beds
3
Baths
1,392
Sq Ft
$183/Sq Ft
Est. Value
About This Home
This home is located at 50 Don Rich Dr, Carrollton, GA 30117 and is currently estimated at $254,371, approximately $182 per square foot. 50 Don Rich Dr is a home located in Carroll County with nearby schools including Central Elementary School, Central Middle School, and Central High School.
Ownership History
Date
Name
Owned For
Owner Type
Purchase Details
Closed on
May 27, 2021
Sold by
Rgr Investments Llc
Bought by
Mack Milicent
Current Estimated Value
Purchase Details
Closed on
Jan 25, 2007
Sold by
Tcz
Bought by
Rgr Investments Llc
Purchase Details
Closed on
Mar 28, 2005
Sold by
Brown Deborah F
Bought by
Tcz
Purchase Details
Closed on
Nov 21, 2003
Sold by
Brown Jason
Bought by
Brown Deborah F
Purchase Details
Closed on
Jan 31, 2001
Sold by
Tiger Relocation Co
Bought by
Brown Jason
Purchase Details
Closed on
Oct 3, 2000
Sold by
Heath Tiffany
Bought by
Tiger Relocation Co
Purchase Details
Closed on
Sep 30, 1998
Sold by
Weber Todd A
Bought by
Heath Tiffany
Purchase Details
Closed on
Dec 30, 1993
Sold by
Weber Greg and Weber Myra
Bought by
Weber Todd A
Purchase Details
Closed on
Mar 16, 1978
Bought by
Weber Greg and Weber Myra
Create a Home Valuation Report for This Property
The Home Valuation Report is an in-depth analysis detailing your home's value as well as a comparison with similar homes in the area
Home Values in the Area
Average Home Value in this Area
Purchase History
| Date | Buyer | Sale Price | Title Company |
|---|---|---|---|
| Mack Milicent | $125,000 | -- | |
| Rgr Investments Llc | $246,000 | -- | |
| Tcz | $115,000 | -- | |
| Brown Deborah F | -- | -- | |
| Brown Jason | $75,000 | -- | |
| Tiger Relocation Co | $97,900 | -- | |
| Heath Tiffany | $107,000 | -- | |
| Weber Todd A | $76,000 | -- | |
| Weber Greg | -- | -- |
Source: Public Records
Tax History Compared to Growth
Tax History
| Year | Tax Paid | Tax Assessment Tax Assessment Total Assessment is a certain percentage of the fair market value that is determined by local assessors to be the total taxable value of land and additions on the property. | Land | Improvement |
|---|---|---|---|---|
| 2024 | $1,879 | $83,051 | $8,029 | $75,022 |
| 2023 | $1,879 | $74,712 | $6,423 | $68,289 |
| 2022 | $1,254 | $59,113 | $4,282 | $54,831 |
| 2021 | $1,295 | $50,500 | $3,426 | $47,074 |
| 2020 | $1,161 | $45,249 | $3,114 | $42,135 |
| 2019 | $1,191 | $46,039 | $8,000 | $38,039 |
| 2018 | $1,121 | $42,682 | $8,000 | $34,682 |
| 2017 | $1,124 | $42,682 | $8,000 | $34,682 |
| 2016 | $1,091 | $48,702 | $8,000 | $40,702 |
| 2015 | $690 | $24,678 | $6,000 | $18,678 |
| 2014 | $693 | $24,678 | $6,000 | $18,678 |
Source: Public Records
Map
Nearby Homes
- 400 Stripling Chapel Rd
- 135 Gray Rd
- 977 Whooping Creek Rd
- 50 Azalea Trail
- 420 Whooping Creek Rd
- 605 Whooping Creek Rd
- 587 Whooping Creek Rd
- 1585 Hays Mill Rd
- Plan 1643 at Windmill Park
- Plan 1830 at Windmill Park
- 203 Vineyard Walk Unit LOT 74
- Plan 2030 at Windmill Park
- 203 Vineyard Walk
- Plan 1727 at Windmill Park
- Plan 1400 at Windmill Park
- 113 Vineyard Walk
- 113 Vineyard Walk Unit LOT 77
- 111 Vineyard Walk
- 111 Vineyard Walk Unit LOT 78
- 50 Sue Alice Ln
- 2079 S Hwy 27 Hwy
- 2079 S Highway 27
- 2079 S Highway 27
- 65 Don Rich Dr
- 60 Don Rich Dr
- 70 Don Rich Dr
- 85 Don Rich Dr
- 80 Don Rich Dr
- 95 Don Rich Dr
- 2030 S Highway 27
- 2030 S Highway 27
- 2030 S Highway 27
- 2030 S Highway 27
- 90 Don Rich Dr
- 2110 S Highway 27
- 2088 S Highway 27
- 105 Don Rich Dr
- 2130 U S 27
- 2130 Us Highway 27
- 110 Don Rich Dr