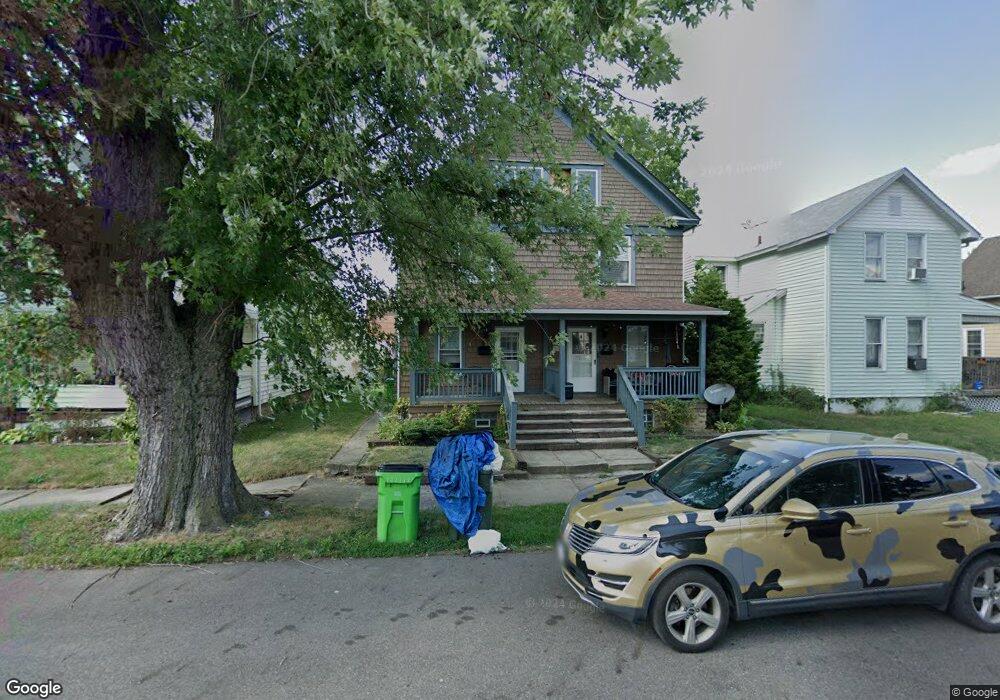
50 E High St Alliance, OH 44601
Estimated Value: $98,000 - $188,171
3
Beds
1
Bath
2,372
Sq Ft
$58/Sq Ft
Est. Value
About This Home
This home is located at 50 E High St, Alliance, OH 44601 and is currently estimated at $138,293, approximately $58 per square foot. 50 E High St is a home located in Stark County with nearby schools including Alliance Intermediate School at Northside, Alliance Elementary School at Rockhill, and Alliance Middle School.
Ownership History
Date
Name
Owned For
Owner Type
Purchase Details
Closed on
Mar 4, 2020
Sold by
Hrh Holdings Llc
Bought by
Edwards Jasmin L
Current Estimated Value
Home Financials for this Owner
Home Financials are based on the most recent Mortgage that was taken out on this home.
Original Mortgage
$108,007
Outstanding Balance
$95,836
Interest Rate
3.6%
Mortgage Type
FHA
Estimated Equity
$42,457
Purchase Details
Closed on
Jan 23, 2019
Sold by
Rainieri Christopher J
Bought by
Hrh Holdings Llc
Purchase Details
Closed on
Sep 20, 2011
Sold by
Asdoda Corporation
Bought by
Rainieri Christopher J
Purchase Details
Closed on
Feb 8, 2011
Sold by
Bbjd Ventures Llc
Bought by
Asdoda
Purchase Details
Closed on
Oct 4, 2010
Sold by
Croley Steve
Bought by
Bbjd Ventures Llc
Purchase Details
Closed on
Mar 19, 1997
Sold by
Rich Darrell J
Bought by
Rich Steve and Rich Donna
Create a Home Valuation Report for This Property
The Home Valuation Report is an in-depth analysis detailing your home's value as well as a comparison with similar homes in the area
Home Values in the Area
Average Home Value in this Area
Purchase History
| Date | Buyer | Sale Price | Title Company |
|---|---|---|---|
| Edwards Jasmin L | $110,000 | None Available | |
| Hrh Holdings Llc | $60,000 | None Available | |
| Rainieri Christopher J | $27,000 | Heritage Union Title Co Ltd | |
| Asdoda | $5,000 | None Available | |
| Bbjd Ventures Llc | $24,000 | Attorney | |
| Rich Steve | $800 | -- |
Source: Public Records
Mortgage History
| Date | Status | Borrower | Loan Amount |
|---|---|---|---|
| Open | Edwards Jasmin L | $108,007 |
Source: Public Records
Tax History
| Year | Tax Paid | Tax Assessment Tax Assessment Total Assessment is a certain percentage of the fair market value that is determined by local assessors to be the total taxable value of land and additions on the property. | Land | Improvement |
|---|---|---|---|---|
| 2025 | -- | $31,300 | $3,680 | $27,620 |
| 2024 | -- | $31,300 | $3,680 | $27,620 |
| 2023 | $1,014 | $24,960 | $2,000 | $22,960 |
| 2022 | $1,021 | $24,960 | $2,000 | $22,960 |
| 2021 | $1,099 | $24,960 | $2,000 | $22,960 |
| 2020 | $690 | $15,510 | $1,750 | $13,760 |
| 2019 | $681 | $15,510 | $1,750 | $13,760 |
| 2018 | $684 | $15,510 | $1,750 | $13,760 |
| 2017 | $618 | $13,760 | $1,440 | $12,320 |
| 2016 | $623 | $13,760 | $1,440 | $12,320 |
| 2015 | $628 | $13,760 | $1,440 | $12,320 |
| 2014 | $576 | $12,010 | $1,300 | $10,710 |
| 2013 | $287 | $12,010 | $1,300 | $10,710 |
Source: Public Records
Map
Nearby Homes
- 62 E High St
- 427 S Union Ave
- 0 E Oxford St
- 62 E Market St
- 163 W Market St
- 228 W Oxford St
- 361 E Main St
- 621 S Haines Ave
- 726 S Arch Ave
- 807 S Union Ave
- V/L S Freedom Ave
- 264 W Market St
- 452 E Summit St
- 46 Rosenberry St
- 234 Rosenberry St
- 231 Rosenberry St
- 118 S Mckinley Ave
- 203 Glamorgan St
- 535 S Mckinley Ave
- 226 Milner St
Your Personal Tour Guide
Ask me questions while you tour the home.