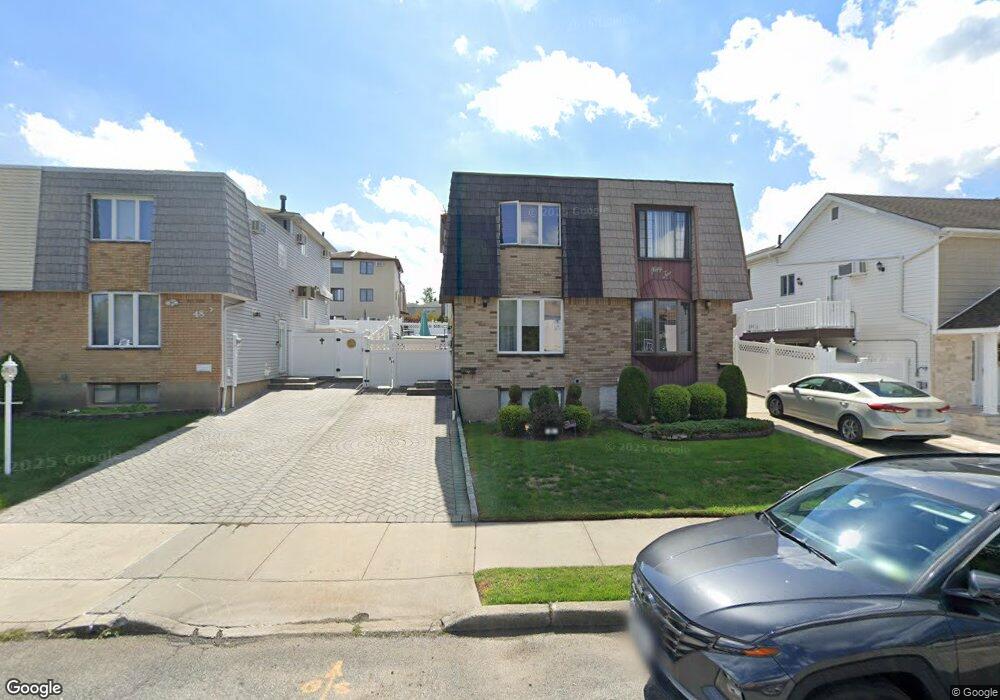
50 E Reading Ave Staten Island, NY 10308
Great Kills NeighborhoodEstimated Value: $667,630 - $707,000
--
Bed
4
Baths
1,600
Sq Ft
$430/Sq Ft
Est. Value
About This Home
This home is located at 50 E Reading Ave, Staten Island, NY 10308 and is currently estimated at $688,158, approximately $430 per square foot. 50 E Reading Ave is a home located in Richmond County with nearby schools including P.S. 32 The Gifford School, I.S. 075 Frank D. Paulo, and Susan E Wagner High School.
Ownership History
Date
Name
Owned For
Owner Type
Purchase Details
Closed on
Nov 11, 2020
Sold by
Benvenuto Family Irrevocable Residence T and Benvenuto Ronald
Bought by
Callahan Dennis R
Current Estimated Value
Home Financials for this Owner
Home Financials are based on the most recent Mortgage that was taken out on this home.
Original Mortgage
$475,000
Interest Rate
2.7%
Mortgage Type
New Conventional
Purchase Details
Closed on
Jul 21, 2020
Sold by
Benvenuto Lori
Bought by
Benvenuto Ronaldo and Benvenuto Fam Irrevocable Residence Tr
Purchase Details
Closed on
Jul 20, 2020
Sold by
Benvenuto Ronald and Benvenuto Fam Irrevocable Resi
Bought by
Benvenuto Eileen
Purchase Details
Closed on
Jun 28, 2018
Sold by
Benvenuto Joseph and Benvenuto Eileen
Bought by
Benvenuto Ronald and Benvenuto Family Irrevocable Residence T
Create a Home Valuation Report for This Property
The Home Valuation Report is an in-depth analysis detailing your home's value as well as a comparison with similar homes in the area
Home Values in the Area
Average Home Value in this Area
Purchase History
| Date | Buyer | Sale Price | Title Company |
|---|---|---|---|
| Callahan Dennis R | $535,000 | Clove Lakes Abstract | |
| Benvenuto Ronaldo | -- | None Available | |
| Benvenuto Eileen | -- | None Available | |
| Benvenuto Ronald | -- | None Available |
Source: Public Records
Mortgage History
| Date | Status | Borrower | Loan Amount |
|---|---|---|---|
| Previous Owner | Callahan Dennis R | $475,000 |
Source: Public Records
Tax History Compared to Growth
Tax History
| Year | Tax Paid | Tax Assessment Tax Assessment Total Assessment is a certain percentage of the fair market value that is determined by local assessors to be the total taxable value of land and additions on the property. | Land | Improvement |
|---|---|---|---|---|
| 2025 | $6,091 | $41,760 | $6,420 | $35,340 |
| 2024 | $6,091 | $39,540 | $6,397 | $33,143 |
| 2023 | $6,159 | $30,326 | $6,056 | $24,270 |
| 2022 | $5,764 | $35,580 | $8,340 | $27,240 |
| 2021 | $5,976 | $34,800 | $8,340 | $26,460 |
| 2020 | $5,011 | $33,960 | $8,340 | $25,620 |
| 2019 | $4,628 | $32,460 | $8,340 | $24,120 |
| 2018 | $4,493 | $25,272 | $8,002 | $17,270 |
| 2017 | $4,259 | $24,060 | $8,340 | $15,720 |
| 2016 | $4,109 | $23,662 | $8,141 | $15,521 |
| 2015 | $3,433 | $22,323 | $6,647 | $15,676 |
| 2014 | $3,433 | $21,060 | $7,200 | $13,860 |
Source: Public Records
Map
Nearby Homes
- 919 Armstrong Ave
- 510 Leverett Ave
- 37 E Stroud Ave
- 147 Cortelyou Ave Unit 2-3
- 57 Middle Loop Rd
- 538 Leverett Ave
- 360 Barlow Ave Unit 32
- 360 Barlow Ave Unit 12
- 248 Abingdon Ave
- 969 Armstrong Ave
- 234 Brookfield Ave
- 339 Abingdon Ave
- 223 Abingdon Ave
- 96 Genesee Ave
- 63 Genesee Ave
- 88 Cortelyou Ave
- 74 E Brandis Ave
- 254 Ridgewood Ave
- 0 Getz Ave
- 423 Eltingville Blvd
- 52 E Reading Ave
- 48 E Reading Ave
- 46 E Reading Ave
- 56 E Reading Ave
- 58 E Reading Ave
- 40 E Reading Ave
- 427 Leverett Ave
- 429 Leverett Ave
- 425 Leverett Ave
- 433 Leverett Ave
- 423 Leverett Ave
- 62 E Reading Ave
- 435 Leverett Ave
- 419 Leverett Ave
- 36 E Reading Ave
- 417 Leverett Ave
- 439 Leverett Ave
- 439 Leverett Ave Unit 2NDFL
- 34 E Reading Ave
- 415 Leverett Ave