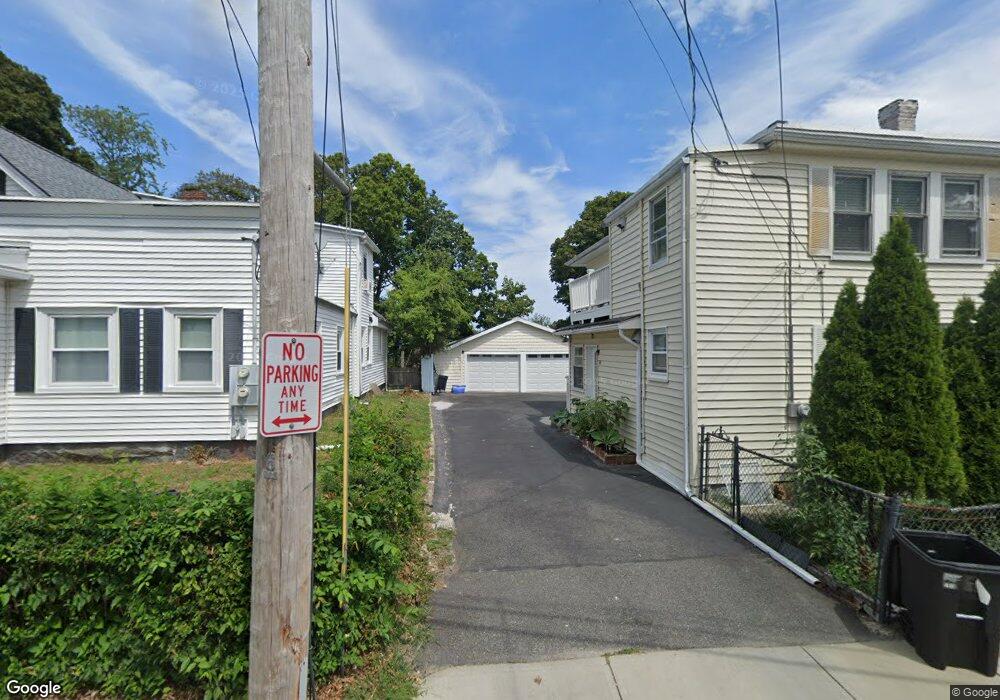
50 Edwards St Quincy, MA 02169
Quincy Point NeighborhoodEstimated Value: $775,458 - $904,000
4
Beds
2
Baths
2,211
Sq Ft
$387/Sq Ft
Est. Value
About This Home
This home is located at 50 Edwards St, Quincy, MA 02169 and is currently estimated at $855,115, approximately $386 per square foot. 50 Edwards St is a home located in Norfolk County with nearby schools including Point Webster Middle School, Clifford H. Marshall Elementary School, and Quincy High School.
Ownership History
Date
Name
Owned For
Owner Type
Purchase Details
Closed on
Apr 2, 2009
Sold by
Huang Jian C and Liu Yan H
Bought by
Huang Jian C
Current Estimated Value
Purchase Details
Closed on
Sep 20, 2005
Sold by
Leung Cevia and Tam David
Bought by
Huang Jian C and Liu Yan H
Home Financials for this Owner
Home Financials are based on the most recent Mortgage that was taken out on this home.
Original Mortgage
$300,000
Interest Rate
5.84%
Mortgage Type
Purchase Money Mortgage
Create a Home Valuation Report for This Property
The Home Valuation Report is an in-depth analysis detailing your home's value as well as a comparison with similar homes in the area
Home Values in the Area
Average Home Value in this Area
Purchase History
| Date | Buyer | Sale Price | Title Company |
|---|---|---|---|
| Huang Jian C | -- | -- | |
| Huang Jian C | $390,000 | -- |
Source: Public Records
Mortgage History
| Date | Status | Borrower | Loan Amount |
|---|---|---|---|
| Previous Owner | Huang Jian C | $300,000 | |
| Previous Owner | Huang Jian C | $50,000 |
Source: Public Records
Tax History
| Year | Tax Paid | Tax Assessment Tax Assessment Total Assessment is a certain percentage of the fair market value that is determined by local assessors to be the total taxable value of land and additions on the property. | Land | Improvement |
|---|---|---|---|---|
| 2025 | $8,202 | $711,400 | $279,500 | $431,900 |
| 2024 | $7,695 | $682,800 | $266,200 | $416,600 |
| 2023 | $7,330 | $658,600 | $242,000 | $416,600 |
| 2022 | $7,437 | $620,800 | $220,000 | $400,800 |
| 2021 | $6,898 | $568,200 | $220,000 | $348,200 |
| 2020 | $6,910 | $555,900 | $207,600 | $348,300 |
| 2019 | $6,431 | $512,400 | $192,200 | $320,200 |
| 2018 | $6,286 | $471,200 | $174,700 | $296,500 |
| 2017 | $5,855 | $413,200 | $166,400 | $246,800 |
| 2016 | $5,303 | $369,300 | $151,200 | $218,100 |
| 2015 | $5,243 | $359,100 | $142,600 | $216,500 |
| 2014 | $4,690 | $315,600 | $142,600 | $173,000 |
Source: Public Records
Map
Nearby Homes
- 5 Main St
- 22 James St
- 24 South St Unit 203
- 35 Miller Stile Rd
- 66 Mcgrath Hwy Unit 305
- 66 Mcgrath Hwy Unit 411
- 66 Mcgrath Hwy Unit 504
- 66 Mcgrath Hwy Unit 202
- 59 Spear St Unit 201
- 59 Spear St Unit 302
- 59 Spear St Unit 202
- 59 Spear St Unit 301
- 33 Elm St
- 51 Sumner St
- 97 Sumner St Unit 1
- 161 Sumner St Unit 2
- 2 Cliveden St Unit 601E
- 2 Cliveden St Unit 405E
- 388 Washington St Unit 301
- 388 Washington St Unit 303
- 50 Edwards St Unit 1
- 68 Union St Unit 1
- 68 Union St Unit 4
- 68 Union St Unit 3
- 68 Union St Unit 2
- 68 Union St
- 42 Edwards St
- 74 Union St
- 51 Edwards St
- 78 Union St
- 36 Edwards St Unit 36
- 36 Edwards St Unit 38
- 69 Union St
- 65 Union St
- 63 Union St
- 39 Edwards St
- 73 Union St
- 53 Union St Unit 2
- 53 Union St Unit 1
- 229 Washington St