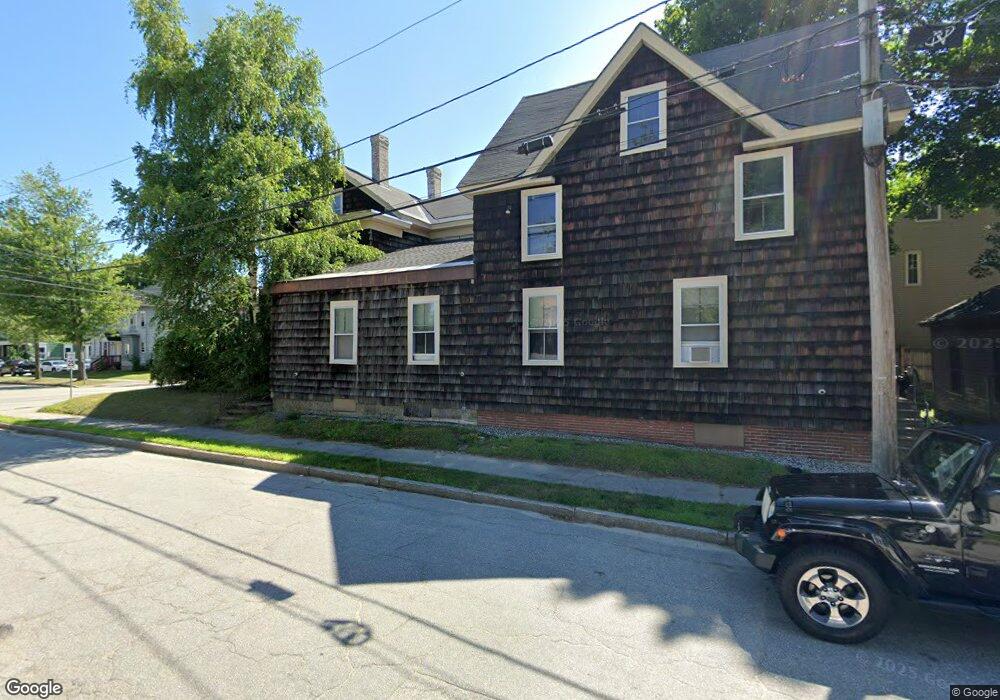
50 Elm St Auburn, ME 04210
Estimated Value: $352,137 - $462,000
9
Beds
1
Bath
5,265
Sq Ft
$78/Sq Ft
Est. Value
About This Home
This home is located at 50 Elm St, Auburn, ME 04210 and is currently estimated at $409,034, approximately $77 per square foot. 50 Elm St is a home located in Androscoggin County with nearby schools including Sherwood Heights Elementary School, Auburn Middle School, and Edward Little High School.
Ownership History
Date
Name
Owned For
Owner Type
Purchase Details
Closed on
Aug 4, 2017
Sold by
Carter Donald
Bought by
Carter Matthew J
Current Estimated Value
Home Financials for this Owner
Home Financials are based on the most recent Mortgage that was taken out on this home.
Original Mortgage
$95,200
Outstanding Balance
$79,308
Interest Rate
3.9%
Mortgage Type
Unknown
Estimated Equity
$329,726
Purchase Details
Closed on
Mar 28, 2011
Sold by
Cwabs Inc
Bought by
Carter Donald
Purchase Details
Closed on
Aug 11, 2010
Sold by
Noyes Glen A and Bank Of New York Mellon
Bought by
Bank Of New York Mellon
Purchase Details
Closed on
Sep 5, 2006
Sold by
Ouellette John D and Ouellette Tammy J
Bought by
Noyes Glen A and Noyes Lorraine T
Home Financials for this Owner
Home Financials are based on the most recent Mortgage that was taken out on this home.
Original Mortgage
$136,000
Interest Rate
11%
Mortgage Type
Adjustable Rate Mortgage/ARM
Create a Home Valuation Report for This Property
The Home Valuation Report is an in-depth analysis detailing your home's value as well as a comparison with similar homes in the area
Home Values in the Area
Average Home Value in this Area
Purchase History
| Date | Buyer | Sale Price | Title Company |
|---|---|---|---|
| Carter Matthew J | -- | -- | |
| Carter Donald | -- | -- | |
| Bank Of New York Mellon | -- | -- | |
| Noyes Glen A | -- | -- |
Source: Public Records
Mortgage History
| Date | Status | Borrower | Loan Amount |
|---|---|---|---|
| Open | Carter Matthew J | $95,200 | |
| Previous Owner | Noyes Glen A | $136,000 | |
| Previous Owner | Noyes Glen A | $34,000 |
Source: Public Records
Tax History Compared to Growth
Tax History
| Year | Tax Paid | Tax Assessment Tax Assessment Total Assessment is a certain percentage of the fair market value that is determined by local assessors to be the total taxable value of land and additions on the property. | Land | Improvement |
|---|---|---|---|---|
| 2024 | $4,977 | $223,700 | $57,400 | $166,300 |
| 2023 | $3,531 | $155,200 | $51,000 | $104,200 |
| 2022 | $2,964 | $130,300 | $42,500 | $87,800 |
| 2021 | $3,104 | $130,300 | $42,500 | $87,800 |
| 2020 | $3,038 | $127,900 | $42,500 | $85,400 |
| 2019 | $3,038 | $127,900 | $42,500 | $85,400 |
| 2018 | $3,872 | $163,500 | $42,500 | $121,000 |
| 2017 | $3,766 | $163,800 | $42,500 | $121,300 |
| 2016 | $3,639 | $162,800 | $42,500 | $120,300 |
| 2015 | $3,460 | $162,800 | $42,500 | $120,300 |
| 2013 | -- | $156,200 | $42,500 | $113,700 |
Source: Public Records
Map
Nearby Homes