50 Elm St Scituate, MA 02066
Estimated Value: $622,000 - $1,151,000
4
Beds
2
Baths
2,461
Sq Ft
$357/Sq Ft
Est. Value
About This Home
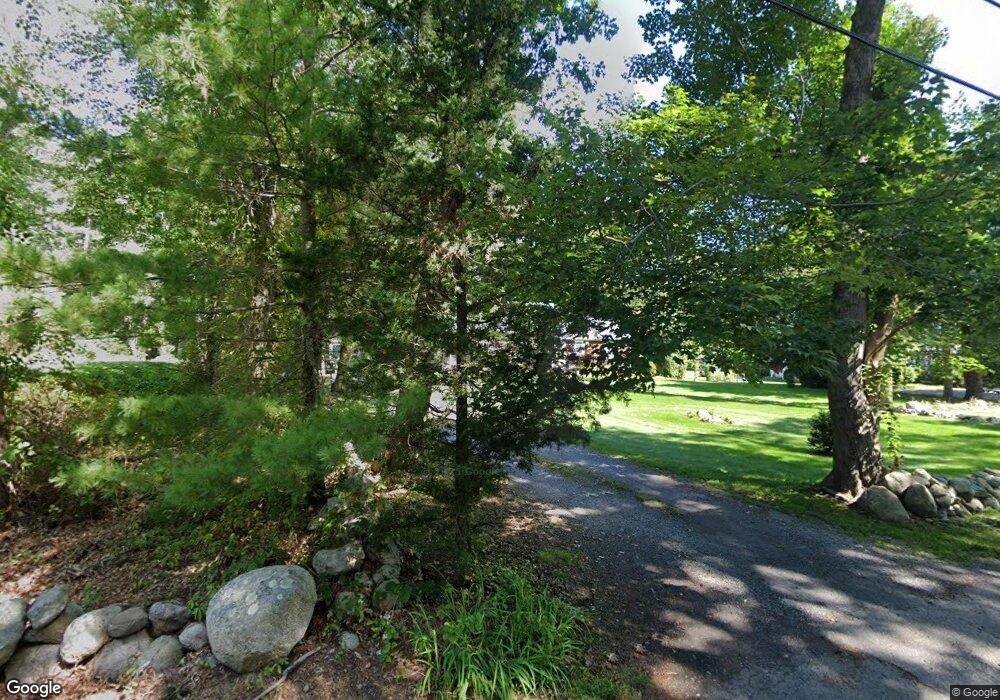
This home is located at 50 Elm St, Scituate, MA 02066 and is currently estimated at $878,391, approximately $356 per square foot. 50 Elm St is a home located in Plymouth County with nearby schools including Jenkins Elementary School, Lester J. Gates Middle School, and Scituate High School.
Ownership History
Date
Name
Owned For
Owner Type
Purchase Details
Closed on
Apr 16, 1998
Sold by
John Tedeschi Custom
Bought by
Bertola Lisa A and Bertola Didier S
Current Estimated Value
Home Financials for this Owner
Home Financials are based on the most recent Mortgage that was taken out on this home.
Original Mortgage
$170,000
Interest Rate
7.11%
Mortgage Type
Purchase Money Mortgage
Purchase Details
Closed on
Dec 23, 1997
Sold by
Rust Donald E and Rust Kathryn L
Bought by
John Tedeschi Custom
Home Financials for this Owner
Home Financials are based on the most recent Mortgage that was taken out on this home.
Original Mortgage
$170,000
Interest Rate
7.14%
Mortgage Type
Purchase Money Mortgage
Purchase Details
Closed on
Dec 19, 1997
Sold by
Rust Donald E and Rust Kathryn L
Bought by
Dempsey Brian T and Dempsey Kathleen M
Home Financials for this Owner
Home Financials are based on the most recent Mortgage that was taken out on this home.
Original Mortgage
$170,000
Interest Rate
7.14%
Mortgage Type
Purchase Money Mortgage
Create a Home Valuation Report for This Property
The Home Valuation Report is an in-depth analysis detailing your home's value as well as a comparison with similar homes in the area
Home Values in the Area
Average Home Value in this Area
Purchase History
| Date | Buyer | Sale Price | Title Company |
|---|---|---|---|
| Bertola Lisa A | $254,000 | -- | |
| John Tedeschi Custom | $77,500 | -- | |
| Dempsey Brian T | $210,000 | -- |
Source: Public Records
Mortgage History
| Date | Status | Borrower | Loan Amount |
|---|---|---|---|
| Open | Dempsey Brian T | $100,000 | |
| Open | Dempsey Brian T | $162,900 | |
| Closed | Dempsey Brian T | $170,000 | |
| Previous Owner | Dempsey Brian T | $170,000 |
Source: Public Records
Tax History
| Year | Tax Paid | Tax Assessment Tax Assessment Total Assessment is a certain percentage of the fair market value that is determined by local assessors to be the total taxable value of land and additions on the property. | Land | Improvement |
|---|---|---|---|---|
| 2025 | $6,556 | $656,300 | $380,100 | $276,200 |
| 2024 | $6,519 | $629,200 | $345,500 | $283,700 |
| 2023 | $6,719 | $595,400 | $331,600 | $263,800 |
| 2022 | $6,719 | $532,400 | $301,600 | $230,800 |
| 2021 | $6,553 | $491,600 | $287,300 | $204,300 |
| 2020 | $6,461 | $478,600 | $276,200 | $202,400 |
| 2019 | $6,447 | $469,200 | $270,800 | $198,400 |
| 2018 | $6,503 | $466,200 | $270,100 | $196,100 |
| 2017 | $6,411 | $455,000 | $258,900 | $196,100 |
| 2016 | $6,114 | $432,400 | $236,300 | $196,100 |
| 2015 | $5,518 | $421,200 | $225,100 | $196,100 |
Source: Public Records
Map
Nearby Homes
- 111 Elm St
- 1 Washington Ln
- 115 Elm St
- 20 Grace Way Unit 20
- 6 Grace Way Unit 6
- 27 Grace Way
- 20 Lee Ave
- 34 Cudworth Rd
- 46 Tilden Rd
- 20 Lawson Rd
- 38 Lauren Ln
- 49 Jackson Rd
- 327 Country Way
- 74 Branch St Unit 15
- 50 First Parish Rd
- 21 Jenkins Place
- 33 Beaver Dam Rd
- 15 Bearce Ln
- 14 Old Country Way Unit C
- 14 Old Country Way Unit B
Your Personal Tour Guide
Ask me questions while you tour the home.