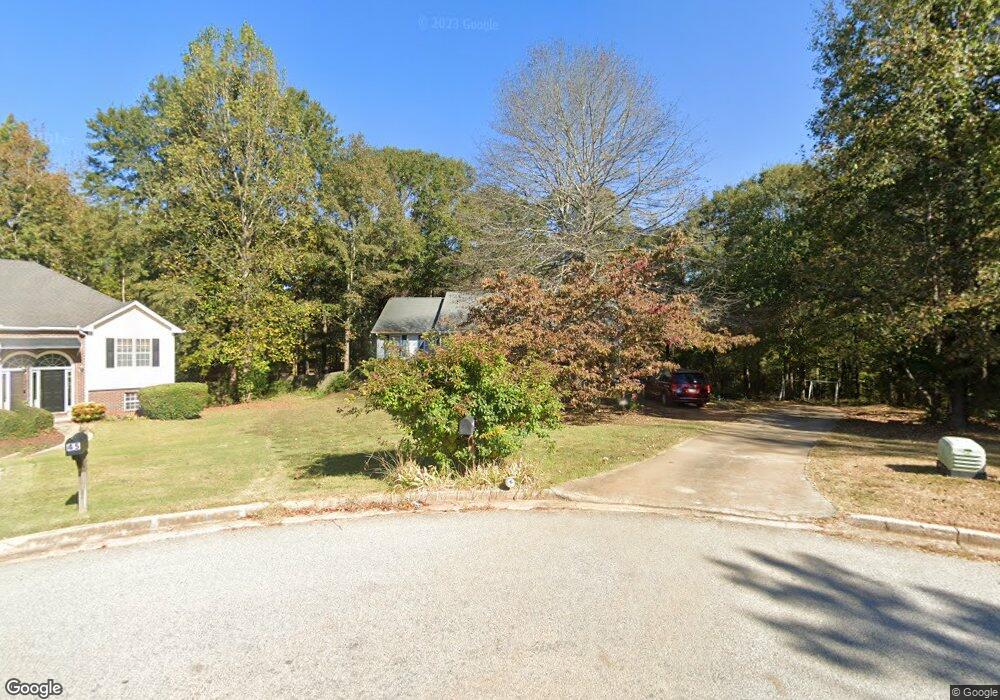
50 Equestrian Ct Covington, GA 30016
Estimated Value: $250,000 - $270,492
--
Bed
3
Baths
1,688
Sq Ft
$155/Sq Ft
Est. Value
About This Home
This home is located at 50 Equestrian Ct, Covington, GA 30016 and is currently estimated at $260,873, approximately $154 per square foot. 50 Equestrian Ct is a home located in Newton County with nearby schools including Oak Hill Elementary School, Veterans Memorial Middle School, and Alcovy High School.
Ownership History
Date
Name
Owned For
Owner Type
Purchase Details
Closed on
Jul 1, 1999
Sold by
Highview Const Inc
Bought by
Taylor Carol A
Current Estimated Value
Home Financials for this Owner
Home Financials are based on the most recent Mortgage that was taken out on this home.
Original Mortgage
$97,100
Interest Rate
7.51%
Mortgage Type
New Conventional
Purchase Details
Closed on
Sep 15, 1997
Sold by
Forkey Mark E and Forkey Laurie M
Bought by
Warbington James I and Warbington Micki L
Home Financials for this Owner
Home Financials are based on the most recent Mortgage that was taken out on this home.
Original Mortgage
$95,000
Interest Rate
7.56%
Mortgage Type
New Conventional
Purchase Details
Closed on
Jul 30, 1996
Sold by
Barber Jerry
Bought by
Forkey Mark Laurie
Create a Home Valuation Report for This Property
The Home Valuation Report is an in-depth analysis detailing your home's value as well as a comparison with similar homes in the area
Home Values in the Area
Average Home Value in this Area
Purchase History
| Date | Buyer | Sale Price | Title Company |
|---|---|---|---|
| Taylor Carol A | $87,900 | -- | |
| Warbington James I | $108,000 | -- | |
| Forkey Mark Laurie | $107,200 | -- |
Source: Public Records
Mortgage History
| Date | Status | Borrower | Loan Amount |
|---|---|---|---|
| Closed | Taylor Carol A | $97,100 | |
| Previous Owner | Warbington James I | $95,000 | |
| Closed | Forkey Mark Laurie | $0 |
Source: Public Records
Tax History Compared to Growth
Tax History
| Year | Tax Paid | Tax Assessment Tax Assessment Total Assessment is a certain percentage of the fair market value that is determined by local assessors to be the total taxable value of land and additions on the property. | Land | Improvement |
|---|---|---|---|---|
| 2024 | $2,279 | $92,480 | $16,800 | $75,680 |
| 2023 | $2,176 | $82,800 | $6,600 | $76,200 |
| 2022 | $1,888 | $72,200 | $6,600 | $65,600 |
| 2021 | $1,818 | $62,720 | $6,600 | $56,120 |
| 2020 | $1,713 | $53,960 | $7,800 | $46,160 |
| 2019 | $1,789 | $55,440 | $7,800 | $47,640 |
| 2018 | $1,585 | $49,160 | $7,800 | $41,360 |
| 2017 | $1,638 | $50,720 | $7,800 | $42,920 |
| 2016 | $1,313 | $41,240 | $5,600 | $35,640 |
| 2015 | $1,324 | $41,640 | $5,600 | $36,040 |
| 2014 | $1,321 | $41,640 | $0 | $0 |
Source: Public Records
Map
Nearby Homes
- 80 Trotters Walk
- 1020 Thornwood Cir
- 330 Christian Woods Dr SE
- 65 King James Ct SE
- 1120 Kinnett Rd
- 13935 Brown Bridge Rd
- 100 Creekside Ln
- 350 Glynnshire Ct Unit 2
- 310 Glynnshire Ct
- 170 Gibson Way
- 4824 Georgia 20
- 14845 Brown Bridge Rd
- 7 Glynnshire Ct
- 175 Glynnshire Ct Unit 2
- 1789 Brandy Dr SE
- 926 Bell Rd SE
- 4260 Brandy Ln SE
- 145 Glynnshire Ct
- 14908 Brown Bridge Rd
- 560 Clearbrook Dr
- 45 Equestrian Ct
- 0 Equestrian Ct
- 40 Equestrian Ct
- 35 Equestrian Ct
- 30 Equestrian Ct
- 25 Equestrian Ct
- 35 Trotters Walk
- 20 Equestrian Ct
- 25 Trotters Walk
- 65 Trotters Walk
- 2147 Blackbird Cir
- 2181 Blackbird Cir
- 2188 Blackbird Cir
- 57 Trotters Walk
- 10 Trotters Ct Unit 10
- 10 Trotters Ct
- 10 Trotters Ct
- 10 Trotters Ct
- 10 Trotters Ct Unit 10
- 75 Trotters Walk