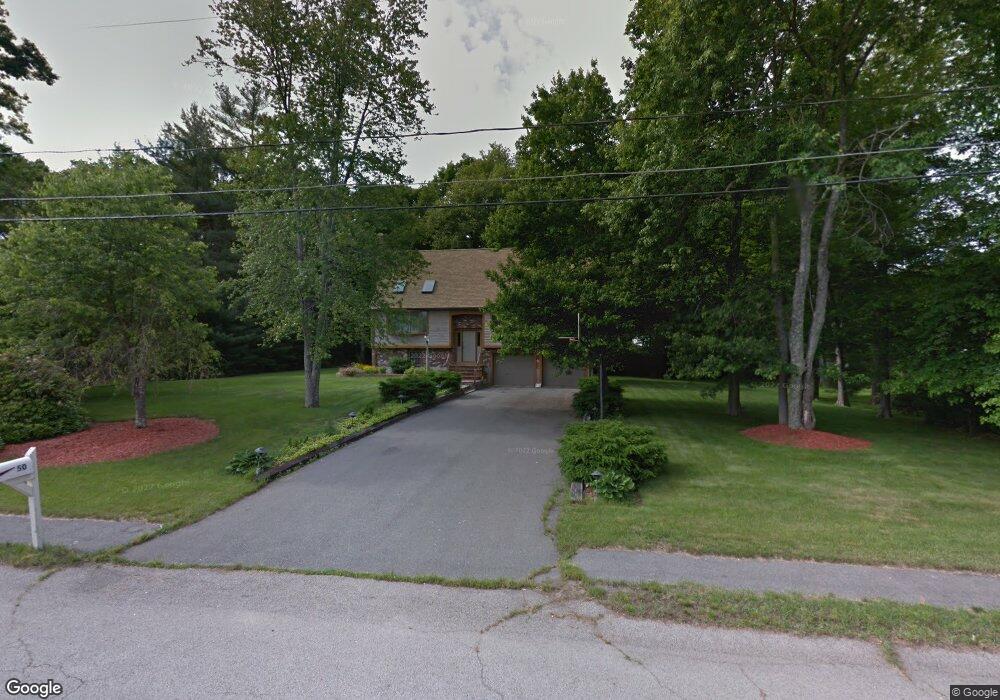
50 Fieldcrest Dr East Bridgewater, MA 02333
Estimated Value: $641,507 - $784,000
3
Beds
3
Baths
2,100
Sq Ft
$344/Sq Ft
Est. Value
About This Home
This home is located at 50 Fieldcrest Dr, East Bridgewater, MA 02333 and is currently estimated at $723,377, approximately $344 per square foot. 50 Fieldcrest Dr is a home located in Plymouth County with nearby schools including Central Elementary School, Gordon W Mitchell Middle School, and East Bridgewater Jr./Sr. High School.
Ownership History
Date
Name
Owned For
Owner Type
Purchase Details
Closed on
Dec 23, 1987
Sold by
Eastbridge Dev Inc
Bought by
Yee James S
Current Estimated Value
Home Financials for this Owner
Home Financials are based on the most recent Mortgage that was taken out on this home.
Original Mortgage
$75,000
Interest Rate
10.67%
Mortgage Type
Purchase Money Mortgage
Create a Home Valuation Report for This Property
The Home Valuation Report is an in-depth analysis detailing your home's value as well as a comparison with similar homes in the area
Home Values in the Area
Average Home Value in this Area
Purchase History
| Date | Buyer | Sale Price | Title Company |
|---|---|---|---|
| Yee James S | $224,900 | -- |
Source: Public Records
Mortgage History
| Date | Status | Borrower | Loan Amount |
|---|---|---|---|
| Open | Yee James S | $96,000 | |
| Closed | Yee James S | $48,000 | |
| Closed | Yee James S | $150,000 | |
| Closed | Yee James S | $75,000 |
Source: Public Records
Tax History Compared to Growth
Tax History
| Year | Tax Paid | Tax Assessment Tax Assessment Total Assessment is a certain percentage of the fair market value that is determined by local assessors to be the total taxable value of land and additions on the property. | Land | Improvement |
|---|---|---|---|---|
| 2025 | $7,734 | $565,800 | $234,800 | $331,000 |
| 2024 | $7,532 | $544,200 | $225,800 | $318,400 |
| 2023 | $7,463 | $516,500 | $225,800 | $290,700 |
| 2022 | $6,923 | $443,800 | $196,800 | $247,000 |
| 2021 | $6,880 | $403,500 | $189,100 | $214,400 |
| 2020 | $6,684 | $386,600 | $181,900 | $204,700 |
| 2019 | $6,480 | $369,000 | $173,800 | $195,200 |
| 2018 | $6,439 | $358,500 | $173,800 | $184,700 |
| 2017 | $6,299 | $344,200 | $165,800 | $178,400 |
| 2016 | $6,085 | $335,100 | $165,800 | $169,300 |
| 2015 | $5,816 | $327,500 | $157,500 | $170,000 |
| 2014 | $5,584 | $321,500 | $154,200 | $167,300 |
Source: Public Records
Map
Nearby Homes
- 587 Bridge St
- 51 Stonegate Dr
- 26 Meadowbrook Dr
- 28 Brookbend Way E
- 71 Stonegate Dr
- 182 Crystal Water Dr Unit 182
- 1993 Washington St
- 217 Crystal Water Dr
- 78 Crystal Water Dr
- 2045 Washington St
- 94 Pond St
- 1 Simmons Place
- 29 Hayes Rd
- 1247 Central St
- 936 Central St
- 455 Plymouth St
- 121 South St
- 23 Stone Meadow Dr
- 261 Plymouth St
- 22 Hudson St
- 3 Fieldcrest Dr
- 42 Fieldcrest Dr
- 55 Fieldcrest Dr
- 40 Fieldcrest Dr
- 43 Fieldcrest Dr
- 39 Fieldcrest Dr
- 9 Fieldcrest Dr
- 4 Fieldcrest Dr
- 92 Crescent St
- 6 Fieldcrest Dr
- 309 Crescent St
- 2 Fieldcrest Dr
- 38 Fieldcrest Dr
- 8 Fieldcrest Dr
- 295 Crescent St
- 285 Crescent St
- 11 Fieldcrest Dr
- 283 Crescent St
- 10 Fieldcrest Dr
- 271 Crescent St