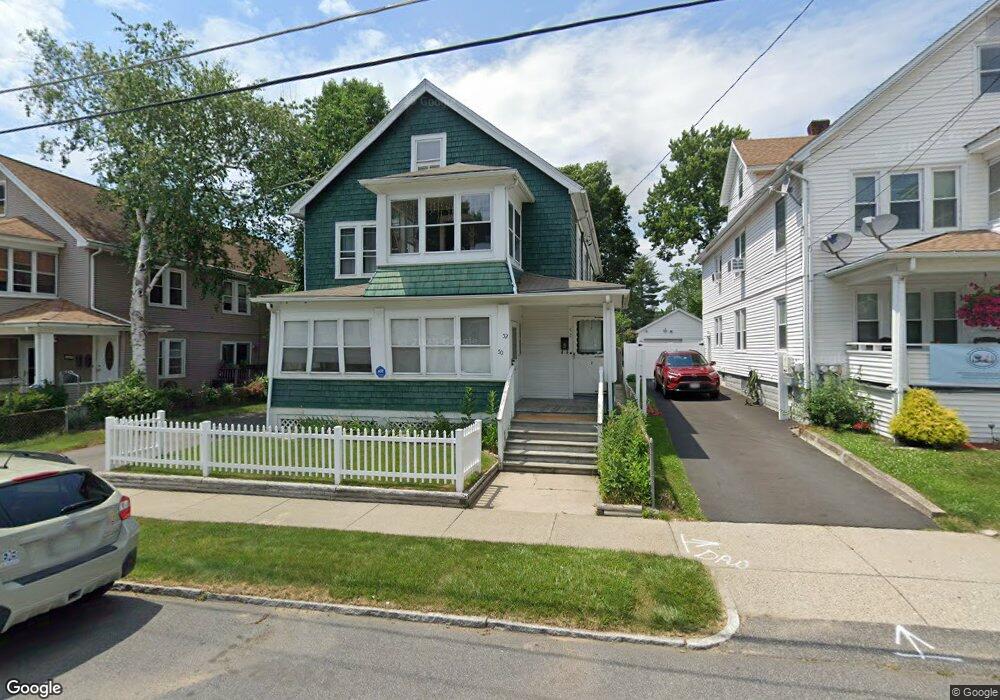
50 Gold St Unit 52 Springfield, MA 01107
Liberty Heights NeighborhoodEstimated Value: $280,391 - $433,000
6
Beds
2
Baths
2,370
Sq Ft
$151/Sq Ft
Est. Value
About This Home
This home is located at 50 Gold St Unit 52, Springfield, MA 01107 and is currently estimated at $358,348, approximately $151 per square foot. 50 Gold St Unit 52 is a home located in Hampden County with nearby schools including Glenwood School, Van Sickle Academy, and Jeff Davis Co Voc Tech Center.
Ownership History
Date
Name
Owned For
Owner Type
Purchase Details
Closed on
Jun 30, 1997
Sold by
Lafleche Adrienne
Bought by
Clowes David L
Current Estimated Value
Home Financials for this Owner
Home Financials are based on the most recent Mortgage that was taken out on this home.
Original Mortgage
$57,000
Outstanding Balance
$7,679
Interest Rate
7.81%
Mortgage Type
Purchase Money Mortgage
Estimated Equity
$350,669
Create a Home Valuation Report for This Property
The Home Valuation Report is an in-depth analysis detailing your home's value as well as a comparison with similar homes in the area
Home Values in the Area
Average Home Value in this Area
Purchase History
| Date | Buyer | Sale Price | Title Company |
|---|---|---|---|
| Clowes David L | $60,000 | -- |
Source: Public Records
Mortgage History
| Date | Status | Borrower | Loan Amount |
|---|---|---|---|
| Open | Clowes David L | $57,000 |
Source: Public Records
Tax History Compared to Growth
Tax History
| Year | Tax Paid | Tax Assessment Tax Assessment Total Assessment is a certain percentage of the fair market value that is determined by local assessors to be the total taxable value of land and additions on the property. | Land | Improvement |
|---|---|---|---|---|
| 2025 | $3,722 | $237,400 | $38,600 | $198,800 |
| 2024 | $3,862 | $240,500 | $38,600 | $201,900 |
| 2023 | $3,378 | $198,100 | $34,200 | $163,900 |
| 2022 | $3,228 | $171,500 | $31,900 | $139,600 |
| 2021 | $3,101 | $164,100 | $29,000 | $135,100 |
| 2020 | $3,178 | $162,700 | $29,000 | $133,700 |
| 2019 | $3,107 | $157,900 | $31,600 | $126,300 |
| 2018 | $3,216 | $163,400 | $31,600 | $131,800 |
| 2017 | $2,906 | $147,800 | $28,600 | $119,200 |
| 2016 | $2,898 | $147,400 | $27,100 | $120,300 |
| 2015 | $2,553 | $129,800 | $27,100 | $102,700 |
Source: Public Records
Map
Nearby Homes
- 54 Gold St Unit 56
- 54-56 Gold St
- 44 Gold St
- 44 Gold St
- 44 Gold St Unit 46
- 58 Gold St Unit 60
- 40 Gold St
- 53 Silver St
- 62 Gold St Unit 64
- 41 Silver St Unit 43
- 57 Silver St
- 47 Silver St
- 47 Silver St Unit 47 silver st
- 45 Gold St
- 55 Gold St
- 37 Silver St
- 49 Gold St
- 66 Gold St Unit 68
- 66-68 Gold St
- 53 Gold St Unit 55