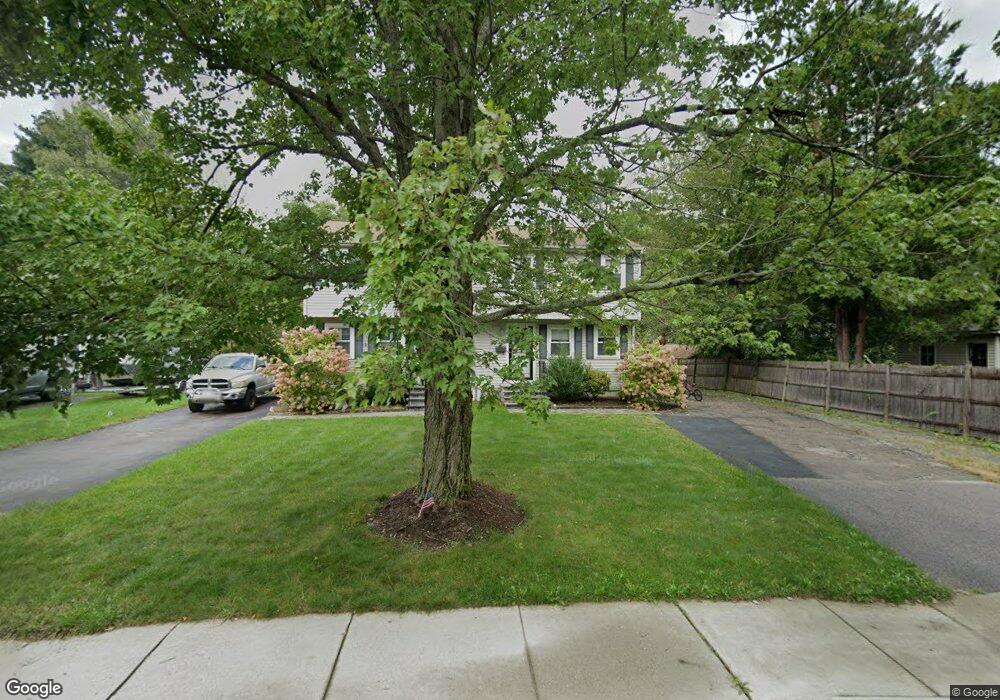
50 Green St Unit B Medfield, MA 02052
Estimated Value: $422,000 - $522,000
2
Beds
1
Bath
1,080
Sq Ft
$426/Sq Ft
Est. Value
About This Home
This home is located at 50 Green St Unit B, Medfield, MA 02052 and is currently estimated at $460,409, approximately $426 per square foot. 50 Green St Unit B is a home located in Norfolk County with nearby schools including Memorial School, Ralph Wheelock School, and Dale Street School.
Ownership History
Date
Name
Owned For
Owner Type
Purchase Details
Closed on
Mar 20, 2019
Sold by
Patel Joshua and Patel Despina
Bought by
Patel Despina
Current Estimated Value
Purchase Details
Closed on
May 31, 2007
Sold by
Maloney Jeffrey A and Maloney Jodee A
Bought by
Hamos Despina and Patel Joshua
Home Financials for this Owner
Home Financials are based on the most recent Mortgage that was taken out on this home.
Original Mortgage
$220,000
Interest Rate
6.24%
Mortgage Type
Purchase Money Mortgage
Purchase Details
Closed on
Jul 27, 2001
Sold by
Bond Robert D and Bond Kimberly R
Bought by
Maloney Jeffrey A
Purchase Details
Closed on
Nov 2, 1993
Sold by
Barisano David J and Barisano Elizabeth A
Bought by
Horwitz Robert A and Horwitz Linda N
Create a Home Valuation Report for This Property
The Home Valuation Report is an in-depth analysis detailing your home's value as well as a comparison with similar homes in the area
Home Values in the Area
Average Home Value in this Area
Purchase History
| Date | Buyer | Sale Price | Title Company |
|---|---|---|---|
| Patel Despina | -- | -- | |
| Patel Despina | -- | -- | |
| Hamos Despina | $275,000 | -- | |
| Hamos Despina | $275,000 | -- | |
| Maloney Jeffrey A | $230,000 | -- | |
| Horwitz Robert A | $112,000 | -- |
Source: Public Records
Mortgage History
| Date | Status | Borrower | Loan Amount |
|---|---|---|---|
| Previous Owner | Horwitz Robert A | $211,125 | |
| Previous Owner | Hamos Despina | $220,000 | |
| Previous Owner | Hamos Despina | $41,250 | |
| Previous Owner | Horwitz Robert A | $220,000 |
Source: Public Records
Tax History Compared to Growth
Tax History
| Year | Tax Paid | Tax Assessment Tax Assessment Total Assessment is a certain percentage of the fair market value that is determined by local assessors to be the total taxable value of land and additions on the property. | Land | Improvement |
|---|---|---|---|---|
| 2025 | $4,880 | $353,600 | $0 | $353,600 |
| 2024 | $5,045 | $344,600 | $0 | $344,600 |
| 2023 | $4,840 | $313,700 | $0 | $313,700 |
| 2022 | $5,057 | $290,300 | $0 | $290,300 |
| 2021 | $5,024 | $282,900 | $0 | $282,900 |
| 2020 | $5,030 | $282,100 | $0 | $282,100 |
| 2019 | $4,739 | $265,200 | $0 | $265,200 |
| 2018 | $4,569 | $268,300 | $0 | $268,300 |
| 2017 | $4,148 | $245,600 | $0 | $245,600 |
| 2016 | $3,807 | $227,300 | $0 | $227,300 |
| 2015 | $3,513 | $219,000 | $0 | $219,000 |
| 2014 | $3,530 | $219,000 | $0 | $219,000 |
Source: Public Records
Map
Nearby Homes
- 431 Main St Unit 5
- 8 Turtlebrook Way
- 46 Frairy St
- 34 Frairy St
- 14 Harding St
- 3 Hennery Way Bld E Unit 3
- 12 Spruce Way
- 94 Pleasant St
- 3 Shining Valley Cir
- 18 Hearthstone Dr
- 6 Alcott Way
- 10 Hillcrest Rd
- 80 West St
- 23 Cross St
- 75 Bridge St
- 94 Elm St
- 111 Elm St
- 3 Spring Valley Rd
- 5 Hamlins Crossing
- 8 Hamlins Crossing
- 50 Green St Unit A
- 50 B Green St Unit 50B
- 52 Green St
- 48 Green St Unit B
- 48 Green St Unit A
- 48 Green St Unit 48A
- 48B Green St Unit B
- 48B Green St
- 56 Green St Unit 2052
- 56 Green St
- 14 Johns Ave
- 12 Johns Ave
- 16 Johns Ave
- 10 Johns Ave
- 60 Green St
- 46 Green St
- 42 Green St
- 18 Johns Ave
- 8 Johns Ave
- 8 Johns Ave Unit 1