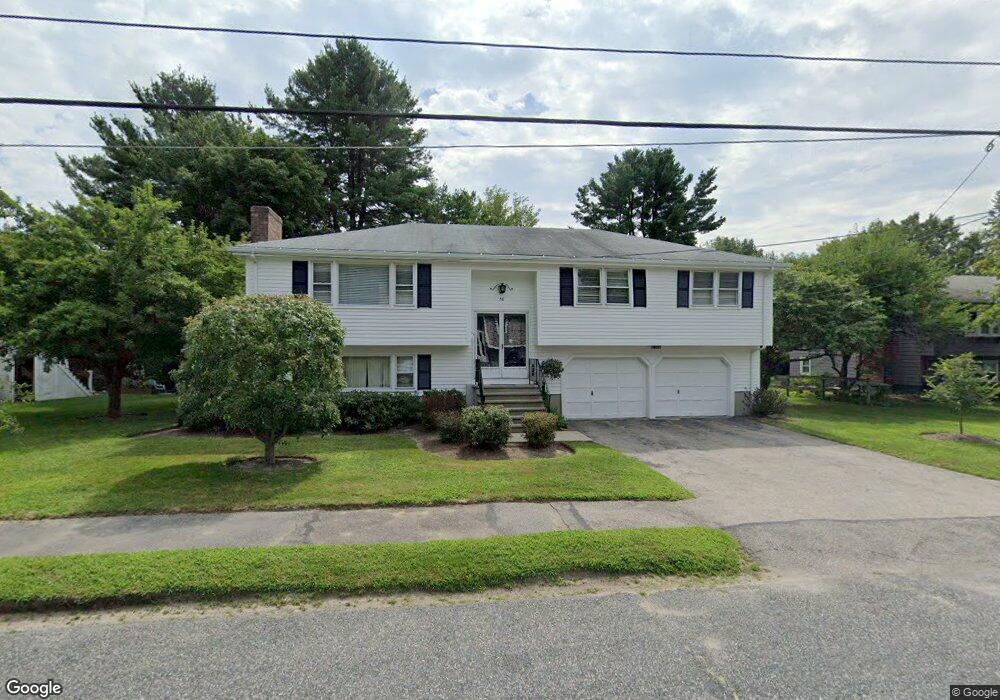
50 Hancock Rd Needham, MA 02492
Estimated Value: $1,073,000 - $1,372,829
3
Beds
3
Baths
1,584
Sq Ft
$767/Sq Ft
Est. Value
About This Home
This home is located at 50 Hancock Rd, Needham, MA 02492 and is currently estimated at $1,215,707, approximately $767 per square foot. 50 Hancock Rd is a home located in Norfolk County with nearby schools including Sunita L. Williams Elementary School, High Rock Middle School, and Pollard Middle School.
Ownership History
Date
Name
Owned For
Owner Type
Purchase Details
Closed on
Jul 23, 2025
Sold by
Cohen Harvey Est and Kenny
Bought by
50 Hancock Llc
Current Estimated Value
Home Financials for this Owner
Home Financials are based on the most recent Mortgage that was taken out on this home.
Original Mortgage
$2,250,000
Outstanding Balance
$2,244,257
Interest Rate
6.84%
Mortgage Type
New Conventional
Estimated Equity
-$1,028,550
Purchase Details
Closed on
Jun 15, 1972
Bought by
Cohen Harvey M and Cohen Dorothy P
Create a Home Valuation Report for This Property
The Home Valuation Report is an in-depth analysis detailing your home's value as well as a comparison with similar homes in the area
Home Values in the Area
Average Home Value in this Area
Purchase History
| Date | Buyer | Sale Price | Title Company |
|---|---|---|---|
| 50 Hancock Llc | $1,100,000 | -- | |
| 50 Hancock Llc | $1,100,000 | -- | |
| Cohen Harvey M | $51,900 | -- |
Source: Public Records
Mortgage History
| Date | Status | Borrower | Loan Amount |
|---|---|---|---|
| Open | 50 Hancock Llc | $2,250,000 | |
| Closed | 50 Hancock Llc | $2,250,000 | |
| Previous Owner | Cohen Harvey M | $230,000 | |
| Previous Owner | Cohen Harvey M | $240,000 |
Source: Public Records
Tax History
| Year | Tax Paid | Tax Assessment Tax Assessment Total Assessment is a certain percentage of the fair market value that is determined by local assessors to be the total taxable value of land and additions on the property. | Land | Improvement |
|---|---|---|---|---|
| 2025 | $11,791 | $1,112,400 | $797,100 | $315,300 |
| 2024 | $10,132 | $809,300 | $504,500 | $304,800 |
| 2023 | $10,210 | $783,000 | $504,500 | $278,500 |
| 2022 | $9,803 | $733,200 | $462,900 | $270,300 |
| 2021 | $9,554 | $733,200 | $462,900 | $270,300 |
| 2020 | $9,375 | $750,600 | $462,800 | $287,800 |
| 2019 | $8,740 | $705,400 | $420,700 | $284,700 |
| 2018 | $8,380 | $705,400 | $420,700 | $284,700 |
| 2017 | $7,951 | $668,700 | $420,700 | $248,000 |
| 2016 | $7,717 | $668,700 | $420,700 | $248,000 |
| 2015 | $7,550 | $668,700 | $420,700 | $248,000 |
| 2014 | $7,061 | $606,600 | $365,800 | $240,800 |
Source: Public Records
Map
Nearby Homes
- 52 Hancock Rd
- 50 Meetinghouse Cir
- 3 Hancock Rd
- 102 Jarvis Cir Unit 102
- 81 Parish Rd
- 620 High Rock St
- 36 Eliot Rd
- 34 Pershing Rd
- 21 Cedar Springs Ln
- 19 Mason Rd
- 193 Garden St
- 100 Rosemary Way Unit 129
- 21 Brewster Dr
- 2 Denmark Ln Unit 2
- 15 Mackintosh Ave
- 37 Standish Rd
- 447 Hillside Ave
- 19 Oakland Ave Unit 19
- 385 Hillside Ave
- 385 Hillside Ave Unit 385
Your Personal Tour Guide
Ask me questions while you tour the home.