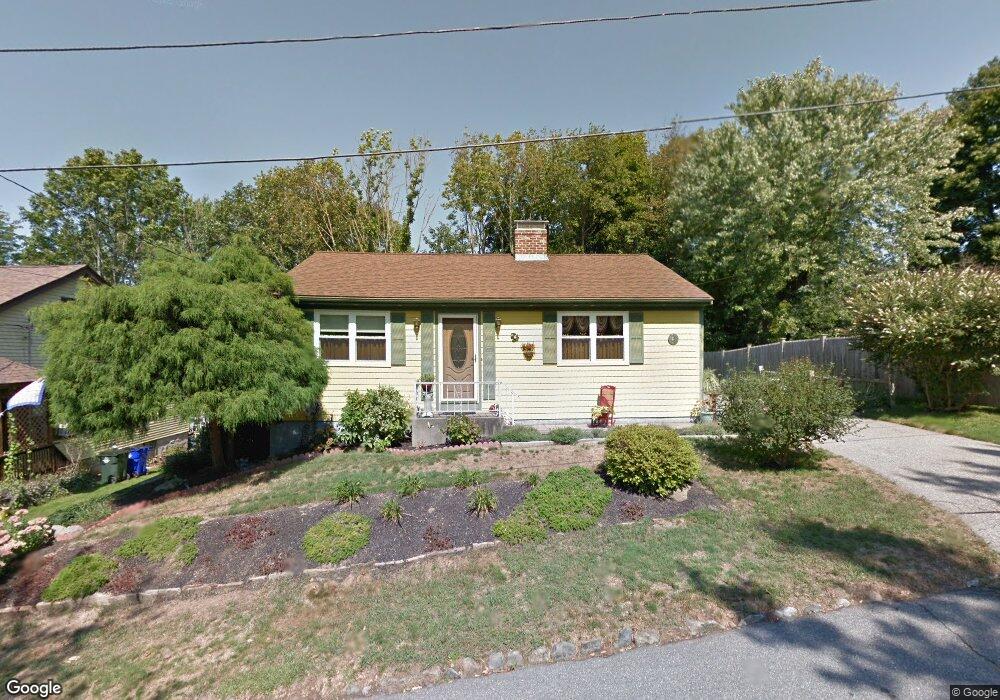
50 Haskell St Fall River, MA 02720
Western Fall River NeighborhoodEstimated Value: $329,000 - $432,000
2
Beds
1
Bath
910
Sq Ft
$418/Sq Ft
Est. Value
About This Home
This home is located at 50 Haskell St, Fall River, MA 02720 and is currently estimated at $380,800, approximately $418 per square foot. 50 Haskell St is a home located in Bristol County with nearby schools including North End Elementary School, Morton Middle School, and B M C Durfee High School.
Ownership History
Date
Name
Owned For
Owner Type
Purchase Details
Closed on
Jul 6, 1989
Sold by
Soares Elias
Bought by
Hill Robert N
Current Estimated Value
Home Financials for this Owner
Home Financials are based on the most recent Mortgage that was taken out on this home.
Original Mortgage
$71,000
Interest Rate
10.38%
Mortgage Type
Purchase Money Mortgage
Create a Home Valuation Report for This Property
The Home Valuation Report is an in-depth analysis detailing your home's value as well as a comparison with similar homes in the area
Home Values in the Area
Average Home Value in this Area
Purchase History
| Date | Buyer | Sale Price | Title Company |
|---|---|---|---|
| Hill Robert N | $96,000 | -- |
Source: Public Records
Mortgage History
| Date | Status | Borrower | Loan Amount |
|---|---|---|---|
| Open | Hill Robert N | $60,000 | |
| Closed | Hill Robert N | $15,000 | |
| Closed | Hill Robert N | $71,500 | |
| Closed | Hill Robert N | $71,000 |
Source: Public Records
Tax History
| Year | Tax Paid | Tax Assessment Tax Assessment Total Assessment is a certain percentage of the fair market value that is determined by local assessors to be the total taxable value of land and additions on the property. | Land | Improvement |
|---|---|---|---|---|
| 2025 | $3,398 | $296,800 | $116,300 | $180,500 |
| 2024 | $3,201 | $278,600 | $114,000 | $164,600 |
| 2023 | $3,112 | $253,600 | $102,700 | $150,900 |
| 2022 | $2,761 | $218,800 | $96,900 | $121,900 |
| 2021 | $2,612 | $188,900 | $92,600 | $96,300 |
| 2020 | $2,524 | $174,700 | $88,400 | $86,300 |
| 2019 | $2,511 | $172,200 | $92,400 | $79,800 |
| 2018 | $2,488 | $170,200 | $93,000 | $77,200 |
| 2017 | $2,363 | $168,800 | $93,000 | $75,800 |
| 2016 | $2,287 | $167,800 | $95,900 | $71,900 |
| 2015 | $2,211 | $169,000 | $95,900 | $73,100 |
| 2014 | $2,126 | $169,000 | $95,900 | $73,100 |
Source: Public Records
Map
Nearby Homes
- 33 Warner St
- 257 Calvin St
- 1810 Highland Ave Unit 22
- Parcel 2 Highcrest Rd
- 29 Valentine St
- 274 Archer St
- 195 Crescent St Unit 3
- 3636 N Main St Unit 5
- 210 Harrison Ave
- 108 Stowe St Unit 108
- 1553 Riverside Ave
- 247 Albany St
- 2714 Riverside Ave
- 1496 Riverside Ave
- 230 College Park Rd
- 333 Langley St
- 201 Montgomery Cir
- 54 Grant Ave
- 17 Langley St
- 2106 Meridian St
- 38 Haskell St
- 66 Haskell St
- 51 Holland St
- 59 Holland St
- 51 Haskell St
- 2779 N Main St
- 2759 N Main St
- 2787 N Main St
- 31 Haskell St
- 79 Holland St
- 2791 N Main St
- 2791 N Main St Unit 2
- 83 Holland St
- 83 Holland St Unit 1
- 2729 N Main St
- 50 Holland St
- 18 Holland St
- 58 Holland St
- 84 Holland St
- 2804 N Main St
Your Personal Tour Guide
Ask me questions while you tour the home.