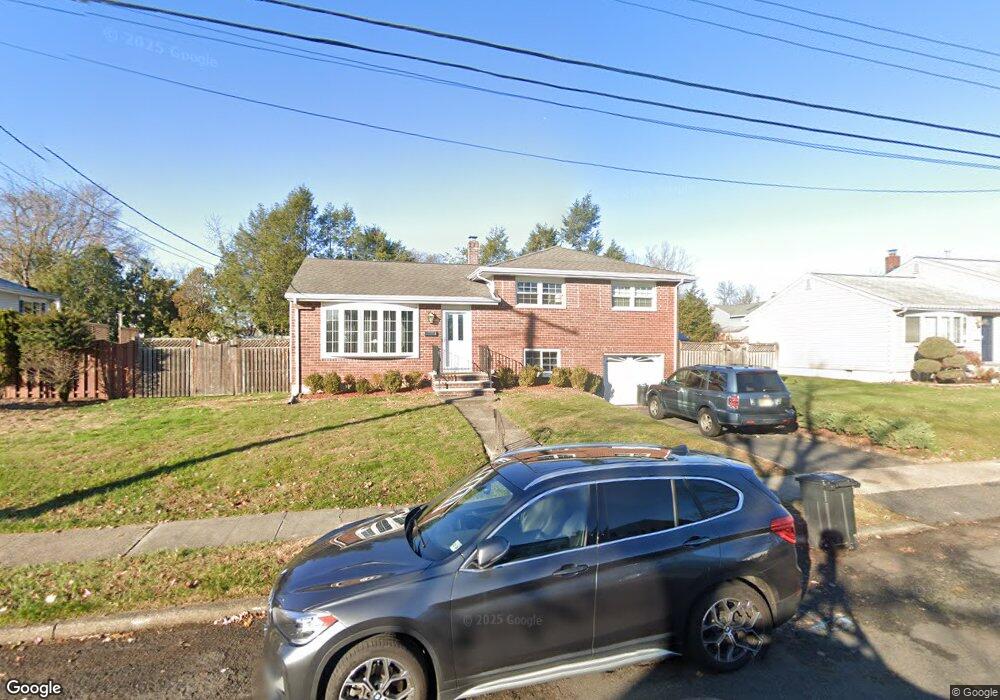
50 Hazel St Dumont, NJ 07628
Estimated Value: $605,052 - $703,000
Studio
--
Bath
1,508
Sq Ft
$444/Sq Ft
Est. Value
About This Home
This home is located at 50 Hazel St, Dumont, NJ 07628 and is currently estimated at $669,763, approximately $444 per square foot. 50 Hazel St is a home located in Bergen County with nearby schools including Dumont High School.
Ownership History
Date
Name
Owned For
Owner Type
Purchase Details
Closed on
Mar 12, 2007
Sold by
Barrezueta Augusto
Bought by
Han Thomas S and Han Yoonhee
Current Estimated Value
Home Financials for this Owner
Home Financials are based on the most recent Mortgage that was taken out on this home.
Original Mortgage
$280,000
Outstanding Balance
$170,775
Interest Rate
6.4%
Estimated Equity
$498,988
Purchase Details
Closed on
Dec 27, 2001
Sold by
Dunn William J
Bought by
Barrezueta Augusto
Home Financials for this Owner
Home Financials are based on the most recent Mortgage that was taken out on this home.
Original Mortgage
$239,000
Interest Rate
7.08%
Create a Home Valuation Report for This Property
The Home Valuation Report is an in-depth analysis detailing your home's value as well as a comparison with similar homes in the area
Home Values in the Area
Average Home Value in this Area
Purchase History
| Date | Buyer | Sale Price | Title Company |
|---|---|---|---|
| Han Thomas S | $470,000 | -- | |
| Barrezueta Augusto | $254,000 | -- |
Source: Public Records
Mortgage History
| Date | Status | Borrower | Loan Amount |
|---|---|---|---|
| Open | Han Thomas S | $280,000 | |
| Previous Owner | Barrezueta Augusto | $239,000 |
Source: Public Records
Tax History
| Year | Tax Paid | Tax Assessment Tax Assessment Total Assessment is a certain percentage of the fair market value that is determined by local assessors to be the total taxable value of land and additions on the property. | Land | Improvement |
|---|---|---|---|---|
| 2025 | $12,423 | $524,400 | $319,500 | $204,900 |
| 2024 | $12,117 | $305,600 | $167,100 | $138,500 |
| 2023 | $11,866 | $305,600 | $167,100 | $138,500 |
| 2022 | $11,866 | $305,600 | $167,100 | $138,500 |
| 2021 | $11,808 | $305,600 | $167,100 | $138,500 |
| 2020 | $11,488 | $305,600 | $167,100 | $138,500 |
| 2019 | $11,212 | $305,600 | $167,100 | $138,500 |
| 2018 | $10,983 | $305,600 | $167,100 | $138,500 |
| 2017 | $10,772 | $305,600 | $167,100 | $138,500 |
| 2016 | $10,522 | $305,600 | $167,100 | $138,500 |
| 2015 | $10,280 | $305,600 | $167,100 | $138,500 |
| 2014 | $10,079 | $305,600 | $167,100 | $138,500 |
Source: Public Records
Map
Nearby Homes
- 15 Pleasant St
- 42 Lenox Ave
- 112 Oxford Place
- 226 Haworth Ave
- 211 Bedford Rd
- 7 Overlook Dr
- 455 Sunset Ave
- 31 Madison Ave
- 39 Drury Ln
- 19 Bedford Rd
- 79 Blauvelt Ave
- 106 Prescott St
- 277 Maple St
- 308 Spring Ln
- 95 W Shore Ave
- 144 New Milford Ave
- 502 Prospect Ave
- 496 Prospect Ave
- 320 Park St
- 65 Prospect Ave
Your Personal Tour Guide
Ask me questions while you tour the home.