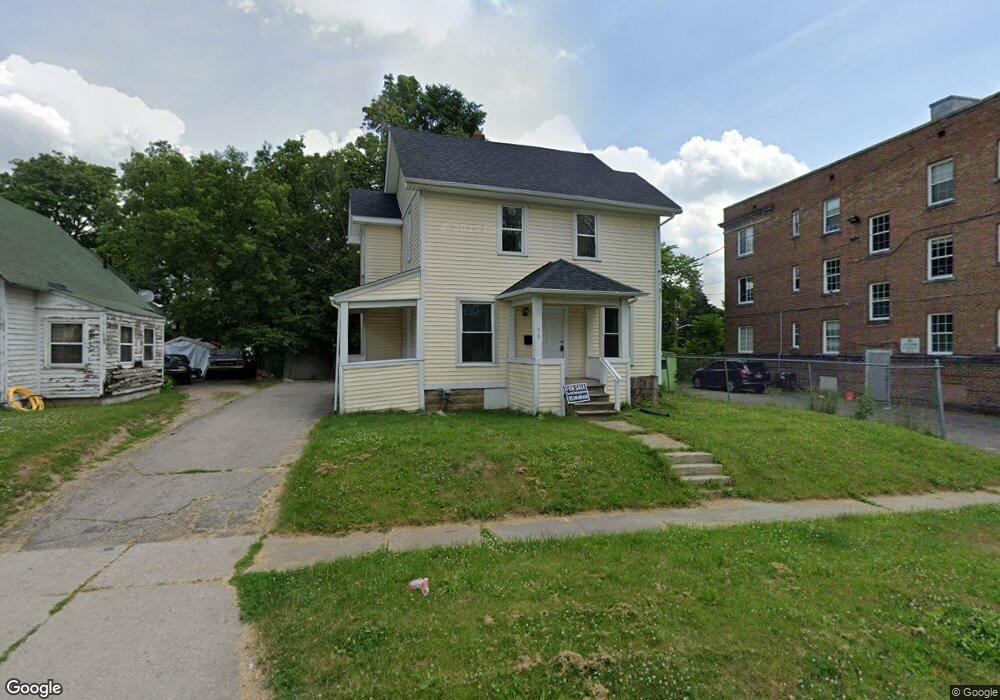
50 Henderson St Unit Bldg-Unit Pontiac, MI 48341
Estimated Value: $109,730 - $119,000
2
Beds
1
Bath
1,234
Sq Ft
$92/Sq Ft
Est. Value
About This Home
This home is located at 50 Henderson St Unit Bldg-Unit, Pontiac, MI 48341 and is currently estimated at $113,933, approximately $92 per square foot. 50 Henderson St Unit Bldg-Unit is a home located in Oakland County with nearby schools including Walt Whitman Elementary School, Pontiac Middle School, and Pontiac High School.
Ownership History
Date
Name
Owned For
Owner Type
Purchase Details
Closed on
Feb 22, 2021
Sold by
Palem Prasanna Antarvedi
Bought by
Aum Llc
Current Estimated Value
Purchase Details
Closed on
Mar 24, 2018
Sold by
Bardocz Steven A
Bought by
Antarvedipalem Prasanna
Purchase Details
Closed on
Nov 1, 2013
Sold by
Oakland County Treasurer
Bought by
Bardocz Steven A
Purchase Details
Closed on
Apr 1, 2012
Sold by
The Prac Team
Bought by
Jina Group Llc
Purchase Details
Closed on
Dec 30, 2009
Sold by
Millennium Properties & Management Compa
Bought by
Property Management Advisors Inc
Purchase Details
Closed on
Dec 28, 1995
Sold by
Elam Candy Lee and Elam Isaac
Bought by
First National Accept Co
Purchase Details
Closed on
May 30, 1995
Sold by
Elam Isaac
Bought by
Black Herbert L
Create a Home Valuation Report for This Property
The Home Valuation Report is an in-depth analysis detailing your home's value as well as a comparison with similar homes in the area
Home Values in the Area
Average Home Value in this Area
Purchase History
| Date | Buyer | Sale Price | Title Company |
|---|---|---|---|
| Aum Llc | -- | None Available | |
| Antarvedipalem Prasanna | $40,000 | None Available | |
| Bardocz Steven A | $2,500 | None Available | |
| Jina Group Llc | -- | None Available | |
| Property Management Advisors Inc | -- | None Available | |
| First National Accept Co | -- | -- | |
| Black Herbert L | $35,000 | -- |
Source: Public Records
Mortgage History
| Date | Status | Borrower | Loan Amount |
|---|---|---|---|
| Closed | Black Herbert L | $0 |
Source: Public Records
Tax History Compared to Growth
Tax History
| Year | Tax Paid | Tax Assessment Tax Assessment Total Assessment is a certain percentage of the fair market value that is determined by local assessors to be the total taxable value of land and additions on the property. | Land | Improvement |
|---|---|---|---|---|
| 2024 | $1,021 | $30,420 | $0 | $0 |
| 2023 | $973 | $25,990 | $0 | $0 |
| 2022 | $1,002 | $22,760 | $0 | $0 |
| 2021 | $973 | $20,220 | $0 | $0 |
| 2020 | $885 | $18,110 | $0 | $0 |
| 2019 | $938 | $15,810 | $0 | $0 |
| 2018 | $654 | $13,440 | $0 | $0 |
| 2017 | $630 | $12,920 | $0 | $0 |
| 2016 | $657 | $13,160 | $0 | $0 |
| 2015 | -- | $12,310 | $0 | $0 |
| 2014 | -- | $10,620 | $0 | $0 |
| 2011 | -- | $15,650 | $0 | $0 |
Source: Public Records
Map
Nearby Homes
- 50 Henderson St
- 73 Henderson St
- 22 Cooley St
- 35 Liberty St
- 363 W Huron St
- 69 Lincoln St
- 124 Henry Clay Ave
- 118 Henry Clay Ave
- 205 Florence St
- 88 Thorpe St
- 39 Portage St
- 94 Dwight Ave
- 72 Norton St
- 391 Lake Shore Dr Unit 36
- 117 Murphy Ave
- V/L W Huron St
- 48 Florence St
- 44 Lake St
- 45 Lake St
- 50 Waldo St
- 56 Henderson St
- 152 Washington St
- 000 Cooley St
- 0 Cooley St
- 0000 Cooley St
- 60 Henderson St
- 66 Henderson St
- 51 Henderson St Unit Bldg-Unit
- 51 Henderson St
- 32 Henderson St
- 41 Henderson St
- 70 Henderson St
- 45 Henderson St
- 67 Henderson St
- 35 Henderson St
- 5 Liberty St
- 5 Liberty St Unit 290
- 76 Henderson St
- 9 Cooley St
- 180 Washington St