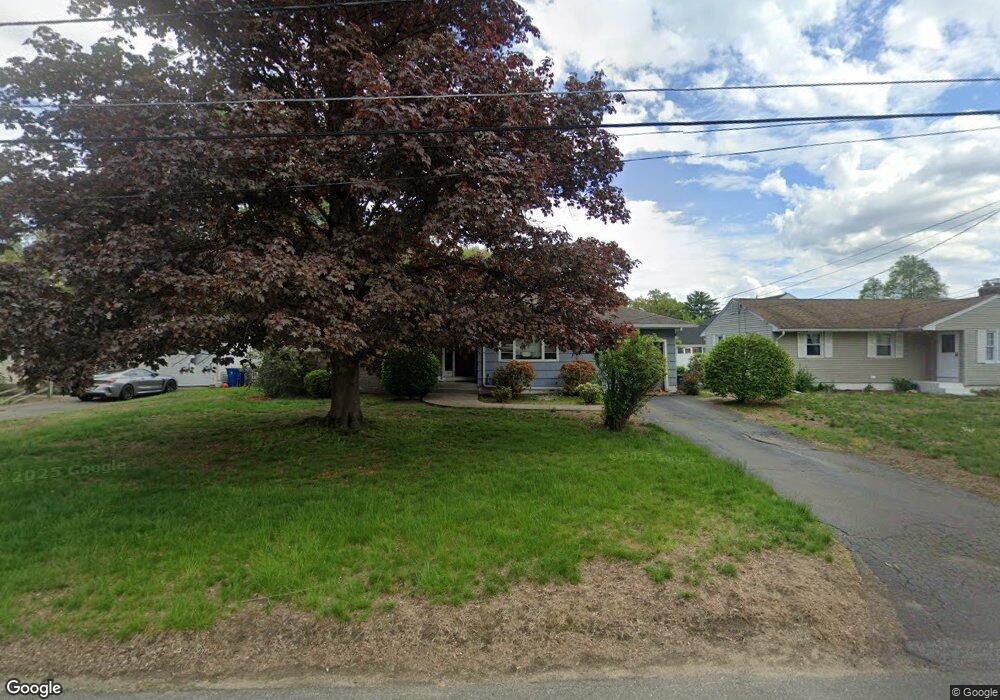
50 Herrman St West Springfield, MA 01089
Estimated Value: $343,000 - $360,000
3
Beds
2
Baths
1,213
Sq Ft
$289/Sq Ft
Est. Value
About This Home
This home is located at 50 Herrman St, West Springfield, MA 01089 and is currently estimated at $350,757, approximately $289 per square foot. 50 Herrman St is a home located in Hampden County with nearby schools including Hampden Charter School of Science West and St Thomas The Apostle School.
Ownership History
Date
Name
Owned For
Owner Type
Purchase Details
Closed on
Dec 30, 1999
Sold by
Weller Linda H
Bought by
Rubin Cheryl A
Current Estimated Value
Home Financials for this Owner
Home Financials are based on the most recent Mortgage that was taken out on this home.
Original Mortgage
$91,200
Outstanding Balance
$28,693
Interest Rate
7.71%
Mortgage Type
Purchase Money Mortgage
Estimated Equity
$322,064
Purchase Details
Closed on
Aug 19, 1994
Sold by
Pash Rt and Koloski Phyllis
Bought by
Weller Linda H
Create a Home Valuation Report for This Property
The Home Valuation Report is an in-depth analysis detailing your home's value as well as a comparison with similar homes in the area
Home Values in the Area
Average Home Value in this Area
Purchase History
| Date | Buyer | Sale Price | Title Company |
|---|---|---|---|
| Rubin Cheryl A | $114,000 | -- | |
| Weller Linda H | $104,000 | -- |
Source: Public Records
Mortgage History
| Date | Status | Borrower | Loan Amount |
|---|---|---|---|
| Open | Weller Linda H | $91,200 |
Source: Public Records
Tax History Compared to Growth
Tax History
| Year | Tax Paid | Tax Assessment Tax Assessment Total Assessment is a certain percentage of the fair market value that is determined by local assessors to be the total taxable value of land and additions on the property. | Land | Improvement |
|---|---|---|---|---|
| 2025 | $4,012 | $269,800 | $99,300 | $170,500 |
| 2024 | $3,956 | $267,100 | $99,300 | $167,800 |
| 2023 | $3,758 | $241,800 | $97,100 | $144,700 |
| 2022 | $3,395 | $215,400 | $88,200 | $127,200 |
| 2021 | $3,356 | $198,600 | $81,600 | $117,000 |
| 2020 | $3,357 | $197,600 | $81,600 | $116,000 |
| 2019 | $3,351 | $197,600 | $81,600 | $116,000 |
| 2018 | $3,369 | $197,600 | $81,600 | $116,000 |
| 2017 | $3,369 | $197,600 | $81,600 | $116,000 |
| 2016 | $3,325 | $195,700 | $76,600 | $119,100 |
| 2015 | $3,260 | $191,900 | $75,100 | $116,800 |
| 2014 | $794 | $192,500 | $75,100 | $117,400 |
Source: Public Records
Map
Nearby Homes