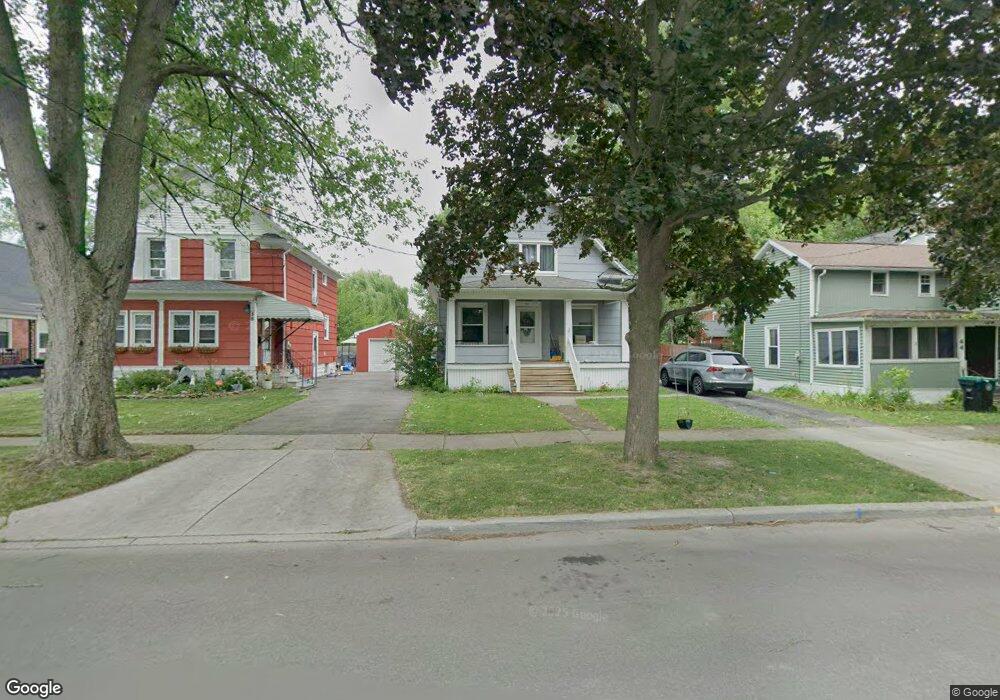
50 Hill St Tonawanda, NY 14150
Estimated Value: $226,423 - $285,000
3
Beds
2
Baths
1,474
Sq Ft
$166/Sq Ft
Est. Value
About This Home
This home is located at 50 Hill St, Tonawanda, NY 14150 and is currently estimated at $244,356, approximately $165 per square foot. 50 Hill St is a home located in Erie County with nearby schools including Riverview Elementary School, Tonawanda Elementary School, and Tonawanda Middle High School.
Ownership History
Date
Name
Owned For
Owner Type
Purchase Details
Closed on
Mar 25, 2009
Sold by
Arida John and Arida Paul
Bought by
Rose Nickolas C
Current Estimated Value
Home Financials for this Owner
Home Financials are based on the most recent Mortgage that was taken out on this home.
Original Mortgage
$122,580
Outstanding Balance
$77,986
Interest Rate
5.14%
Mortgage Type
VA
Estimated Equity
$166,370
Purchase Details
Closed on
Dec 18, 2007
Sold by
Stevens Jacqueline C
Bought by
Arida Paul and Arida John
Purchase Details
Closed on
Feb 11, 2000
Sold by
Florian John P and Baumgartner Amy
Bought by
Stuermer Michael
Create a Home Valuation Report for This Property
The Home Valuation Report is an in-depth analysis detailing your home's value as well as a comparison with similar homes in the area
Home Values in the Area
Average Home Value in this Area
Purchase History
| Date | Buyer | Sale Price | Title Company |
|---|---|---|---|
| Rose Nickolas C | $120,000 | None Available | |
| Arida Paul | $15,000 | None Available | |
| Stuermer Michael | $76,750 | -- |
Source: Public Records
Mortgage History
| Date | Status | Borrower | Loan Amount |
|---|---|---|---|
| Open | Rose Nickolas C | $122,580 |
Source: Public Records
Tax History Compared to Growth
Tax History
| Year | Tax Paid | Tax Assessment Tax Assessment Total Assessment is a certain percentage of the fair market value that is determined by local assessors to be the total taxable value of land and additions on the property. | Land | Improvement |
|---|---|---|---|---|
| 2024 | $2,101 | $173,000 | $13,200 | $159,800 |
| 2023 | $1,285 | $173,000 | $13,200 | $159,800 |
| 2022 | $1,997 | $110,000 | $9,200 | $100,800 |
| 2021 | $1,988 | $110,000 | $9,200 | $100,800 |
| 2020 | $1,759 | $110,000 | $9,200 | $100,800 |
| 2019 | $3,955 | $110,000 | $9,200 | $100,800 |
| 2018 | $1,680 | $110,000 | $9,200 | $100,800 |
| 2017 | $576 | $112,000 | $7,200 | $104,800 |
| 2016 | $1,904 | $112,000 | $7,200 | $104,800 |
| 2015 | -- | $112,000 | $7,200 | $104,800 |
| 2014 | -- | $112,000 | $7,200 | $104,800 |
Source: Public Records
Map
Nearby Homes