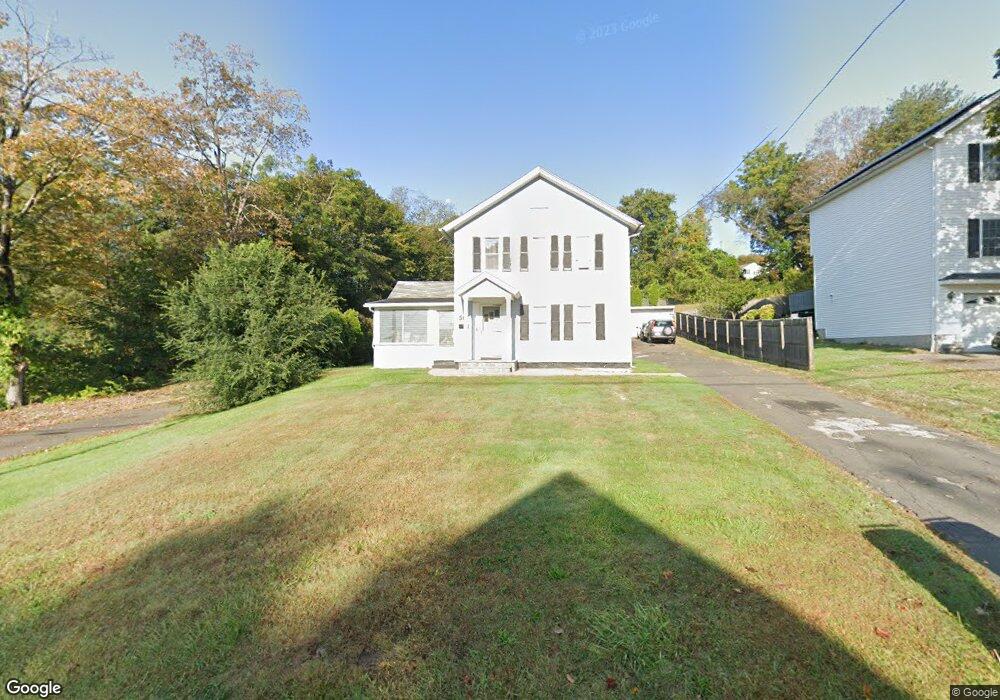
50 Hoadley St Naugatuck, CT 06770
Estimated Value: $287,537 - $326,000
4
Beds
2
Baths
1,313
Sq Ft
$233/Sq Ft
Est. Value
About This Home
This home is located at 50 Hoadley St, Naugatuck, CT 06770 and is currently estimated at $306,384, approximately $233 per square foot. 50 Hoadley St is a home located in New Haven County with nearby schools including City Hill Middle School and Naugatuck High School.
Ownership History
Date
Name
Owned For
Owner Type
Purchase Details
Closed on
Apr 11, 2011
Sold by
Salvo Ronald M and Salvo Michelle
Bought by
Federal National Mortgage Association
Current Estimated Value
Purchase Details
Closed on
Jun 28, 2004
Sold by
Murphy Ryan and Murphy Elisa
Bought by
Salvo Ronald M and Slavo Michelle
Home Financials for this Owner
Home Financials are based on the most recent Mortgage that was taken out on this home.
Original Mortgage
$139,920
Interest Rate
6.32%
Mortgage Type
Purchase Money Mortgage
Purchase Details
Closed on
Jul 2, 2001
Sold by
Andrew Framing Inc
Bought by
Murphy Ryan and Benegoss Elisa
Create a Home Valuation Report for This Property
The Home Valuation Report is an in-depth analysis detailing your home's value as well as a comparison with similar homes in the area
Home Values in the Area
Average Home Value in this Area
Purchase History
| Date | Buyer | Sale Price | Title Company |
|---|---|---|---|
| Federal National Mortgage Association | -- | -- | |
| Salvo Ronald M | $174,900 | -- | |
| Murphy Ryan | $102,000 | -- |
Source: Public Records
Mortgage History
| Date | Status | Borrower | Loan Amount |
|---|---|---|---|
| Open | Murphy Ryan | $6,000 | |
| Previous Owner | Murphy Ryan | $57,200 | |
| Previous Owner | Murphy Ryan | $139,920 |
Source: Public Records
Tax History
| Year | Tax Paid | Tax Assessment Tax Assessment Total Assessment is a certain percentage of the fair market value that is determined by local assessors to be the total taxable value of land and additions on the property. | Land | Improvement |
|---|---|---|---|---|
| 2025 | $5,080 | $127,680 | $32,340 | $95,340 |
| 2024 | $5,336 | $127,680 | $32,340 | $95,340 |
| 2023 | $5,714 | $127,680 | $32,340 | $95,340 |
| 2022 | $5,168 | $108,240 | $34,600 | $73,640 |
| 2021 | $5,168 | $108,240 | $34,600 | $73,640 |
| 2020 | $5,168 | $108,240 | $34,600 | $73,640 |
| 2019 | $5,114 | $108,240 | $34,600 | $73,640 |
| 2018 | $4,604 | $95,220 | $41,640 | $53,580 |
| 2017 | $4,623 | $95,220 | $41,640 | $53,580 |
| 2016 | $4,539 | $95,220 | $41,640 | $53,580 |
| 2015 | $4,339 | $95,220 | $41,640 | $53,580 |
| 2014 | $4,291 | $95,220 | $41,640 | $53,580 |
| 2012 | $4,373 | $130,330 | $52,570 | $77,760 |
Source: Public Records
Map
Nearby Homes
- 470 Rubber Ave
- 16 Phyllis Dr
- 80 Cliff St
- 51 Joseph Rd
- 71 Cliff St
- 89 N Hoadley St
- 30 Pond St
- 671 Rubber Ave
- 0 Andrew Mountain Rd Unit 170603648
- 150 Scott St
- 128 Millville Ave
- 92 Birch Ln
- 167 N Hoadley St
- 41 Millville Ave Unit 201
- 233 Conrad St
- 22 Lewis St
- 72 Hilltop Rd
- 80 Olive St
- 23 Salem St
- 309 N Hoadley St
Your Personal Tour Guide
Ask me questions while you tour the home.