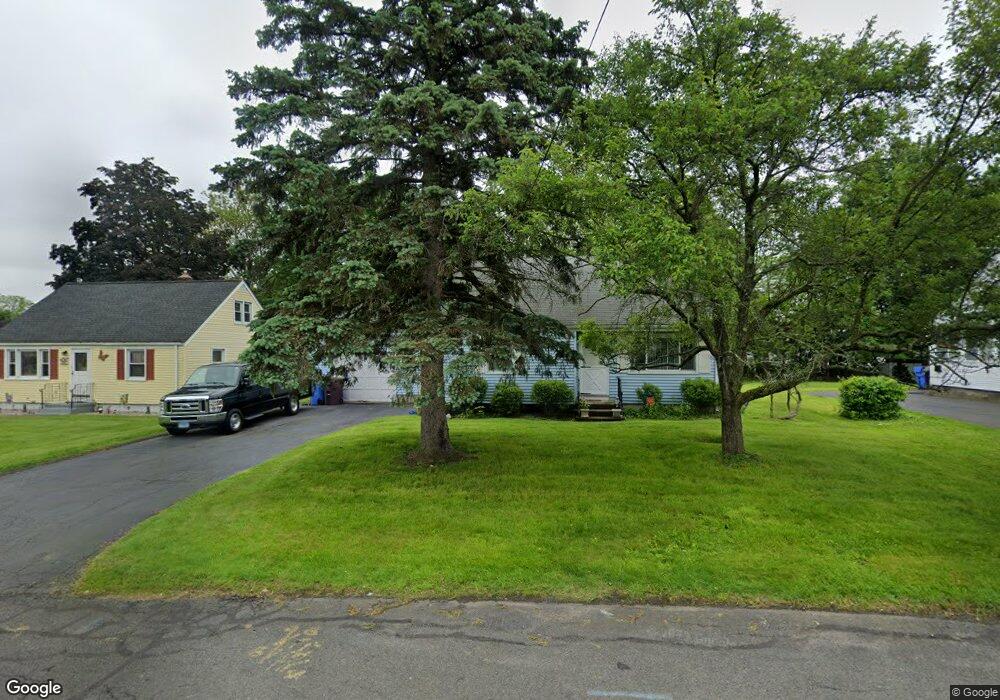
50 Howe Rd New Britain, CT 06053
Estimated Value: $209,000 - $309,000
4
Beds
2
Baths
1,259
Sq Ft
$215/Sq Ft
Est. Value
About This Home
This home is located at 50 Howe Rd, New Britain, CT 06053 and is currently estimated at $270,323, approximately $214 per square foot. 50 Howe Rd is a home located in Hartford County with nearby schools including Jefferson School, Pulaski Middle School, and St. Francis of Assisi Middle School.
Ownership History
Date
Name
Owned For
Owner Type
Purchase Details
Closed on
Aug 1, 2000
Sold by
Usa Hub
Bought by
Black Tyrone C
Current Estimated Value
Home Financials for this Owner
Home Financials are based on the most recent Mortgage that was taken out on this home.
Original Mortgage
$73,350
Interest Rate
8.18%
Purchase Details
Closed on
Jun 9, 1997
Sold by
Perzan Richard and Perzan Debra
Bought by
Carter Shannon E
Purchase Details
Closed on
Jul 28, 1995
Sold by
Toce Richard and Toce Patricia
Bought by
Miller Neil
Purchase Details
Closed on
Feb 28, 1995
Sold by
Syphers Vance A and Syphers Donna R
Bought by
Centerbank
Purchase Details
Closed on
May 16, 1988
Sold by
Bill Frank
Bought by
Latin Amn Invest Grp
Create a Home Valuation Report for This Property
The Home Valuation Report is an in-depth analysis detailing your home's value as well as a comparison with similar homes in the area
Home Values in the Area
Average Home Value in this Area
Purchase History
| Date | Buyer | Sale Price | Title Company |
|---|---|---|---|
| Black Tyrone C | $77,257 | -- | |
| Carter Shannon E | $74,000 | -- | |
| Miller Neil | $39,600 | -- | |
| Centerbank | $137,498 | -- | |
| Latin Amn Invest Grp | $300,000 | -- |
Source: Public Records
Mortgage History
| Date | Status | Borrower | Loan Amount |
|---|---|---|---|
| Open | Latin Amn Invest Grp | $166,372 | |
| Closed | Latin Amn Invest Grp | $147,600 | |
| Closed | Latin Amn Invest Grp | $73,350 |
Source: Public Records
Tax History Compared to Growth
Tax History
| Year | Tax Paid | Tax Assessment Tax Assessment Total Assessment is a certain percentage of the fair market value that is determined by local assessors to be the total taxable value of land and additions on the property. | Land | Improvement |
|---|---|---|---|---|
| 2025 | $5,186 | $132,370 | $49,630 | $82,740 |
| 2024 | $5,241 | $132,370 | $49,630 | $82,740 |
| 2023 | $5,067 | $132,370 | $49,630 | $82,740 |
| 2022 | $4,553 | $91,980 | $20,860 | $71,120 |
| 2021 | $4,553 | $91,980 | $20,860 | $71,120 |
| 2020 | $4,645 | $91,980 | $20,860 | $71,120 |
| 2019 | $4,645 | $91,980 | $20,860 | $71,120 |
| 2018 | $4,645 | $91,980 | $20,860 | $71,120 |
| 2017 | $4,373 | $86,590 | $20,860 | $65,730 |
| 2016 | $4,373 | $86,590 | $20,860 | $65,730 |
| 2015 | $4,243 | $86,590 | $20,860 | $65,730 |
| 2014 | $4,243 | $86,590 | $20,860 | $65,730 |
Source: Public Records
Map
Nearby Homes
- 910 Farmington Ave
- 34 Hutchinson St
- 187 Miriam Rd
- 55 Horseplain Rd
- 57 Merigold Dr
- 83 Kim Dr
- 59 Heather Ln
- 1114 Fienemann Rd
- 67 Eastwick Rd
- 16 Jeffrey Dr
- 410 Farmington Ave Unit O6
- 148 Governor St
- 27 Candlewood Ln
- 394 Mcclintock St
- 152 Oakland Ave
- 90 Country Club Rd
- 95 Pierremount Ave
- 234 Pierremount Ave
- 55 Alexander Rd
- 8128 Colt Hwy