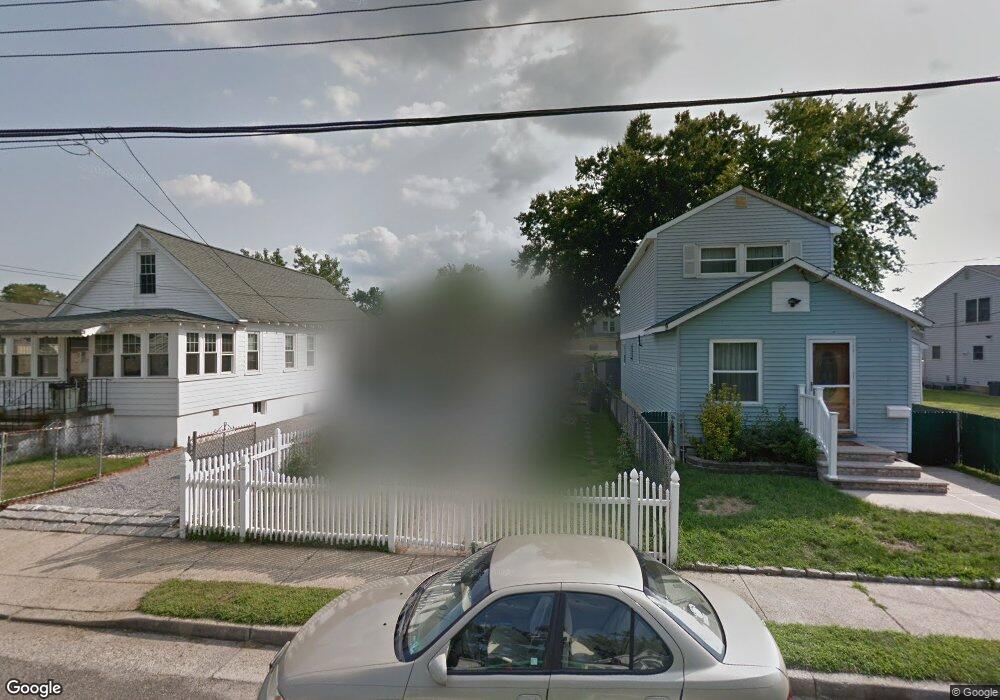
50 Ideal Ave North Middletown, NJ 07748
Estimated Value: $328,000 - $360,000
2
Beds
1
Bath
792
Sq Ft
$429/Sq Ft
Est. Value
About This Home
This home is located at 50 Ideal Ave, North Middletown, NJ 07748 and is currently estimated at $339,404, approximately $428 per square foot. 50 Ideal Ave is a home located in Monmouth County with nearby schools including Ocean Avenue Elementary School, Thorne Middle School, and Middletown High School North.
Ownership History
Date
Name
Owned For
Owner Type
Purchase Details
Closed on
Jun 23, 2006
Sold by
Walker Monique
Bought by
Meade Francis W and Meade Tammy D
Current Estimated Value
Home Financials for this Owner
Home Financials are based on the most recent Mortgage that was taken out on this home.
Original Mortgage
$217,550
Outstanding Balance
$128,116
Interest Rate
6.6%
Mortgage Type
New Conventional
Estimated Equity
$211,288
Purchase Details
Closed on
Jun 14, 2002
Sold by
Piordan Pat
Bought by
Walker Monique
Home Financials for this Owner
Home Financials are based on the most recent Mortgage that was taken out on this home.
Original Mortgage
$133,000
Interest Rate
6.19%
Purchase Details
Closed on
Feb 22, 2002
Sold by
Hwang Sok
Bought by
Riordan Pat
Purchase Details
Closed on
Jul 15, 1994
Sold by
H U D
Bought by
Hwang Sok
Home Financials for this Owner
Home Financials are based on the most recent Mortgage that was taken out on this home.
Original Mortgage
$35,000
Interest Rate
8.19%
Mortgage Type
FHA
Create a Home Valuation Report for This Property
The Home Valuation Report is an in-depth analysis detailing your home's value as well as a comparison with similar homes in the area
Home Values in the Area
Average Home Value in this Area
Purchase History
| Date | Buyer | Sale Price | Title Company |
|---|---|---|---|
| Meade Francis W | $229,000 | -- | |
| Walker Monique | $140,000 | -- | |
| Riordan Pat | $70,000 | -- | |
| Hwang Sok | $35,000 | -- |
Source: Public Records
Mortgage History
| Date | Status | Borrower | Loan Amount |
|---|---|---|---|
| Open | Meade Francis W | $217,550 | |
| Previous Owner | Walker Monique | $133,000 | |
| Previous Owner | Hwang Sok | $35,000 |
Source: Public Records
Tax History Compared to Growth
Tax History
| Year | Tax Paid | Tax Assessment Tax Assessment Total Assessment is a certain percentage of the fair market value that is determined by local assessors to be the total taxable value of land and additions on the property. | Land | Improvement |
|---|---|---|---|---|
| 2025 | $4,136 | $300,300 | $225,000 | $75,300 |
| 2024 | $4,098 | $251,400 | $177,500 | $73,900 |
| 2023 | $4,098 | $235,800 | $155,000 | $80,800 |
| 2022 | $3,532 | $190,700 | $112,500 | $78,200 |
| 2021 | $3,532 | $169,800 | $91,300 | $78,500 |
| 2020 | $3,139 | $146,800 | $70,000 | $76,800 |
| 2019 | $2,942 | $139,300 | $70,000 | $69,300 |
| 2018 | $3,055 | $141,000 | $75,000 | $66,000 |
| 2017 | $3,097 | $141,500 | $77,500 | $64,000 |
| 2016 | $2,798 | $131,300 | $62,500 | $68,800 |
| 2015 | $2,891 | $131,000 | $62,500 | $68,500 |
| 2014 | $3,397 | $150,100 | $87,500 | $62,600 |
Source: Public Records
Map
Nearby Homes
- 31 Ocean Ave
- 289 Port Monmouth Rd
- 31 Monmouth Ave
- 98 Seabreeze Ave
- 91 Monmouth Ave
- 71 Bay Ave
- 93 Monmouth Ave
- 231 Shore Blvd
- 10 Morningside Ave
- 170 Park Ave
- 443 Port Monmouth Rd E
- 12 Orchard St
- 166 Shore Blvd
- 280 Linden Ave
- 210 Ocean Ave
- 151 Shore Blvd
- 173 Forest Ave
- 22 Carter Ave
- 25 Lawrence Ave
- 123 Forest Ave