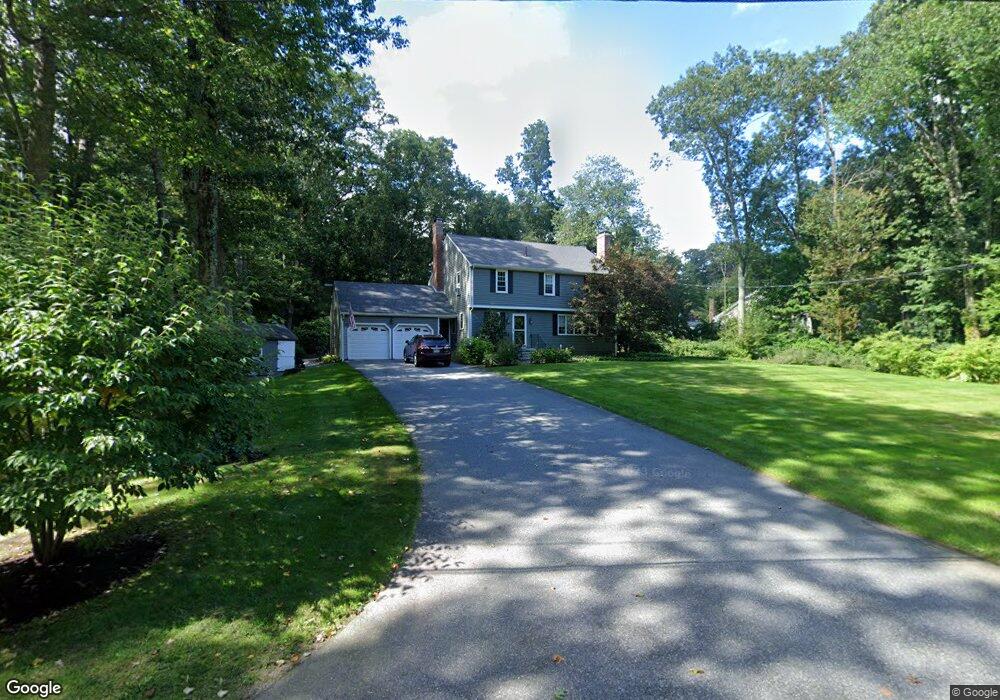
50 Ivy Ln Sherborn, MA 01770
Estimated Value: $1,205,176 - $1,334,000
4
Beds
3
Baths
3,060
Sq Ft
$416/Sq Ft
Est. Value
About This Home
This home is located at 50 Ivy Ln, Sherborn, MA 01770 and is currently estimated at $1,273,294, approximately $416 per square foot. 50 Ivy Ln is a home located in Middlesex County with nearby schools including Pine Hill Elementary School, Dover-Sherborn Regional Middle School, and Dover-Sherborn Regional High School.
Ownership History
Date
Name
Owned For
Owner Type
Purchase Details
Closed on
Nov 5, 2014
Sold by
Lewis Adrienne and Lewis William D
Bought by
Adrienne J Lewis Ret
Current Estimated Value
Create a Home Valuation Report for This Property
The Home Valuation Report is an in-depth analysis detailing your home's value as well as a comparison with similar homes in the area
Home Values in the Area
Average Home Value in this Area
Purchase History
| Date | Buyer | Sale Price | Title Company |
|---|---|---|---|
| Adrienne J Lewis Ret | -- | -- |
Source: Public Records
Tax History Compared to Growth
Tax History
| Year | Tax Paid | Tax Assessment Tax Assessment Total Assessment is a certain percentage of the fair market value that is determined by local assessors to be the total taxable value of land and additions on the property. | Land | Improvement |
|---|---|---|---|---|
| 2025 | $19,518 | $1,177,200 | $453,100 | $724,100 |
| 2024 | $18,338 | $1,081,900 | $453,100 | $628,800 |
| 2023 | $16,775 | $931,400 | $453,100 | $478,300 |
| 2022 | $15,468 | $812,800 | $442,900 | $369,900 |
| 2021 | $15,419 | $785,500 | $442,900 | $342,600 |
| 2020 | $15,286 | $785,500 | $442,900 | $342,600 |
| 2019 | $15,329 | $781,300 | $442,900 | $338,400 |
| 2018 | $5,310 | $770,800 | $442,900 | $327,900 |
| 2017 | $14,817 | $724,200 | $442,900 | $281,300 |
| 2016 | $14,767 | $717,900 | $442,900 | $275,000 |
| 2015 | $14,468 | $712,000 | $437,900 | $274,100 |
| 2014 | $13,795 | $678,200 | $417,900 | $260,300 |
Source: Public Records
Map
Nearby Homes
- 2 Surrey Ln
- 7 Fawn Rd
- 14 Sewall Brook Ln
- 4 Green Ln
- 61 Old Orchard Rd
- 65 Farm Road Lot 6
- 18 Wildwood Dr
- 20 Nason Hill Rd
- 220 S Main St
- 32 Lake St
- 6 Brook St
- 105 N Main St
- 54 Spywood Rd
- 38 Bullard St
- 27 Spywood Rd
- 00000 S Main St and Bullard St
- 21 Spywood Rd
- 15 Wyndemere Ln
- 151 Mohawk Path
- 114 Farm St