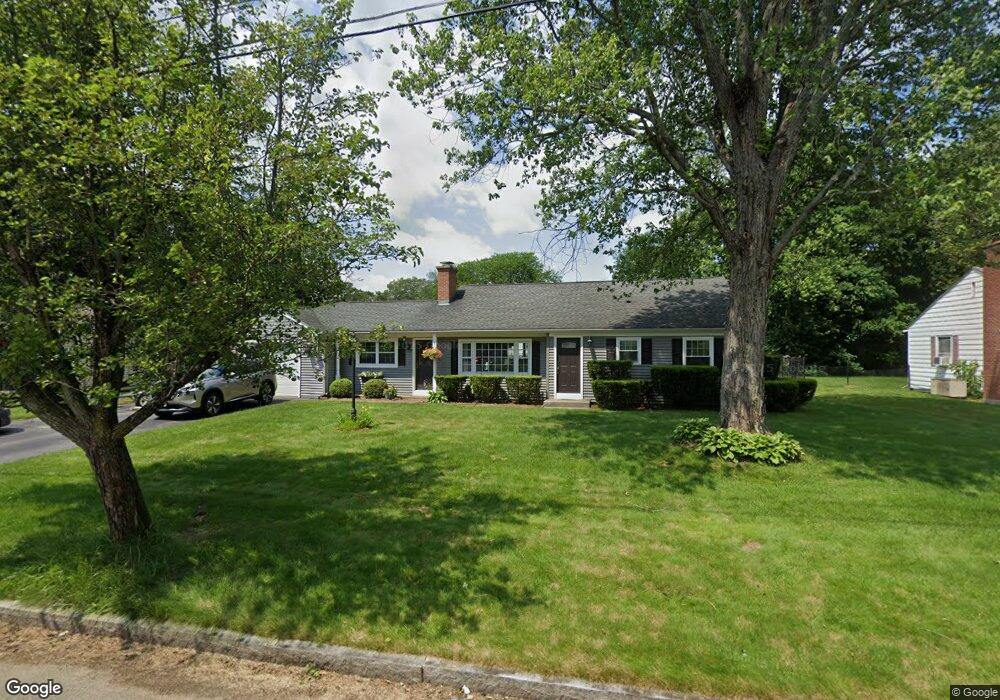
50 Jeffrey Rd Springfield, MA 01119
Sixteen Acres NeighborhoodEstimated Value: $331,000 - $352,000
2
Beds
1
Bath
1,372
Sq Ft
$248/Sq Ft
Est. Value
About This Home
This home is located at 50 Jeffrey Rd, Springfield, MA 01119 and is currently estimated at $340,828, approximately $248 per square foot. 50 Jeffrey Rd is a home located in Hampden County with nearby schools including Glickman Elementary, John J Duggan Middle, and Springfield High School of Science and Technology.
Ownership History
Date
Name
Owned For
Owner Type
Purchase Details
Closed on
Jun 21, 2024
Sold by
Miceli Michael
Bought by
Miceli Michael and Sizer Melissa M
Current Estimated Value
Purchase Details
Closed on
Jan 10, 2003
Sold by
Younger Christine and Younger Gary
Bought by
Miceli Michael
Home Financials for this Owner
Home Financials are based on the most recent Mortgage that was taken out on this home.
Original Mortgage
$127,991
Interest Rate
6.19%
Mortgage Type
Purchase Money Mortgage
Purchase Details
Closed on
Jul 21, 1999
Sold by
Miller John E and Miller Cynthia P
Bought by
Paxman Christine A and Dansereau Lois J
Purchase Details
Closed on
Aug 16, 1988
Sold by
Snopek Paul
Bought by
Miller John E
Create a Home Valuation Report for This Property
The Home Valuation Report is an in-depth analysis detailing your home's value as well as a comparison with similar homes in the area
Home Values in the Area
Average Home Value in this Area
Purchase History
| Date | Buyer | Sale Price | Title Company |
|---|---|---|---|
| Miceli Michael | -- | None Available | |
| Miceli Michael | -- | None Available | |
| Miceli Michael | $130,000 | -- | |
| Paxman Christine A | $107,000 | -- | |
| Miceli Michael | $130,000 | -- | |
| Paxman Christine A | $107,000 | -- | |
| Miller John E | $125,000 | -- |
Source: Public Records
Mortgage History
| Date | Status | Borrower | Loan Amount |
|---|---|---|---|
| Previous Owner | Miller John E | $172,211 | |
| Previous Owner | Miceli Michael | $127,991 | |
| Previous Owner | Miller John E | $103,500 |
Source: Public Records
Tax History
| Year | Tax Paid | Tax Assessment Tax Assessment Total Assessment is a certain percentage of the fair market value that is determined by local assessors to be the total taxable value of land and additions on the property. | Land | Improvement |
|---|---|---|---|---|
| 2025 | $5,408 | $344,900 | $53,400 | $291,500 |
| 2024 | $4,890 | $304,500 | $53,400 | $251,100 |
| 2023 | $4,469 | $262,100 | $50,900 | $211,200 |
| 2022 | $4,374 | $232,400 | $50,900 | $181,500 |
| 2021 | $3,914 | $207,100 | $46,300 | $160,800 |
| 2020 | $3,935 | $201,500 | $46,300 | $155,200 |
| 2019 | $3,922 | $199,300 | $46,300 | $153,000 |
| 2018 | $3,733 | $189,700 | $46,300 | $143,400 |
| 2017 | $3,492 | $177,600 | $42,900 | $134,700 |
| 2016 | $3,279 | $166,800 | $42,900 | $123,900 |
| 2015 | $3,295 | $167,500 | $42,900 | $124,600 |
Source: Public Records
Map
Nearby Homes
- 108 Birchland Ave
- 63 Granger St
- 46 Puritan Cir
- 381 N Brook Rd
- Lot 37 Kane St
- 73 Timber Ln
- 74 Valley Rd
- 106-108 Breckwood Cir
- 186 Bolton St
- 854 Grayson Dr
- 64 Wilmington St
- 130 Spear Rd
- 63 Lawton St
- 25 Nassau Dr Unit 25
- 71 Nassau Dr
- 44 Nassau Dr
- 251 Rosewell St
- 8 Putnam St
- 114 Riverton Rd
- 187 Lamont St
- 40 Jeffrey Rd
- 60 Jeffrey Rd
- 55 Birchland Ave
- 65 Birchland Ave
- 51 Jeffrey Rd
- 70 Jeffrey Rd
- 30 Jeffrey Rd
- 39 Jeffrey Rd
- 67 Jeffrey Rd
- 75 Birchland Ave
- 33 Birchland Ave
- 27 Jeffrey Rd
- 22 Jeffrey Rd
- 80 Jeffrey Rd
- 18 Charlton St
- 15 Charlton St
- 56 Birchland Ave
- 85 Birchland Ave
- 23 Birchland Ave
- 68 Birchland Ave
Your Personal Tour Guide
Ask me questions while you tour the home.