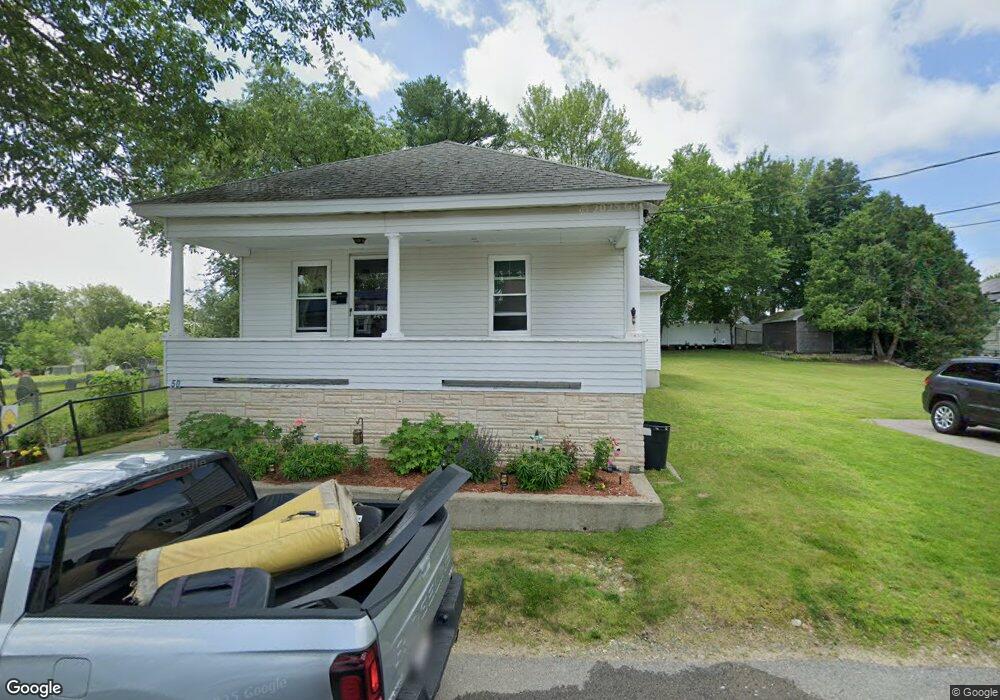
50 Jordan St Lowell, MA 01854
Pawtucketville NeighborhoodEstimated Value: $454,000 - $559,515
2
Beds
1
Bath
700
Sq Ft
$726/Sq Ft
Est. Value
About This Home
This home is located at 50 Jordan St, Lowell, MA 01854 and is currently estimated at $507,879, approximately $725 per square foot. 50 Jordan St is a home located in Middlesex County with nearby schools including Joseph McAvinnue Elementary School, Charlotte M. Murkland Elementary School, and Charles W. Morey Elementary School.
Ownership History
Date
Name
Owned For
Owner Type
Purchase Details
Closed on
Mar 21, 2000
Sold by
Est Landry Laurette C and Lambert Ernest A
Bought by
Dunn Steven P and Dunn Kerrie Ann
Current Estimated Value
Home Financials for this Owner
Home Financials are based on the most recent Mortgage that was taken out on this home.
Original Mortgage
$122,050
Outstanding Balance
$41,215
Interest Rate
8.24%
Mortgage Type
Purchase Money Mortgage
Estimated Equity
$466,664
Create a Home Valuation Report for This Property
The Home Valuation Report is an in-depth analysis detailing your home's value as well as a comparison with similar homes in the area
Home Values in the Area
Average Home Value in this Area
Purchase History
| Date | Buyer | Sale Price | Title Company |
|---|---|---|---|
| Dunn Steven P | $128,500 | -- | |
| Dunn Steven P | $128,500 | -- |
Source: Public Records
Mortgage History
| Date | Status | Borrower | Loan Amount |
|---|---|---|---|
| Open | Dunn Steven P | $35,000 | |
| Open | Dunn Steven P | $122,050 | |
| Closed | Dunn Steven P | $122,050 |
Source: Public Records
Tax History Compared to Growth
Tax History
| Year | Tax Paid | Tax Assessment Tax Assessment Total Assessment is a certain percentage of the fair market value that is determined by local assessors to be the total taxable value of land and additions on the property. | Land | Improvement |
|---|---|---|---|---|
| 2025 | $5,585 | $486,500 | $208,300 | $278,200 |
| 2024 | $5,620 | $471,900 | $220,100 | $251,800 |
| 2023 | $5,267 | $424,100 | $198,700 | $225,400 |
| 2022 | $5,043 | $397,400 | $180,600 | $216,800 |
| 2021 | $4,863 | $361,300 | $157,100 | $204,200 |
| 2020 | $4,363 | $326,600 | $133,800 | $192,800 |
| 2019 | $4,111 | $292,800 | $113,200 | $179,600 |
| 2018 | $3,790 | $263,400 | $107,800 | $155,600 |
| 2017 | $3,617 | $242,400 | $100,800 | $141,600 |
| 2016 | $3,456 | $228,000 | $97,800 | $130,200 |
| 2015 | $3,229 | $208,600 | $97,800 | $110,800 |
| 2013 | $3,320 | $221,200 | $114,300 | $106,900 |
Source: Public Records
Map
Nearby Homes